Gold Price Analysis: Attempted recovery might still be seen as selling opportunity


  • Gold gains some traction on Monday and recovers further from one-month lows.
  • The near-term technical set-up still seems tilted firmly in favour of bearish traders.
  • Move beyond $1700 should remain capped near trend-channel support breakpoint.

Gold managed to close a modest weekly bearish gap of around $10 and was last seen trading near the top end of its daily trading range, just below the $1695 level. The uptick comes after Friday's late rebound from one-month lows, around the $1670 level and supports prospects for additional gains.

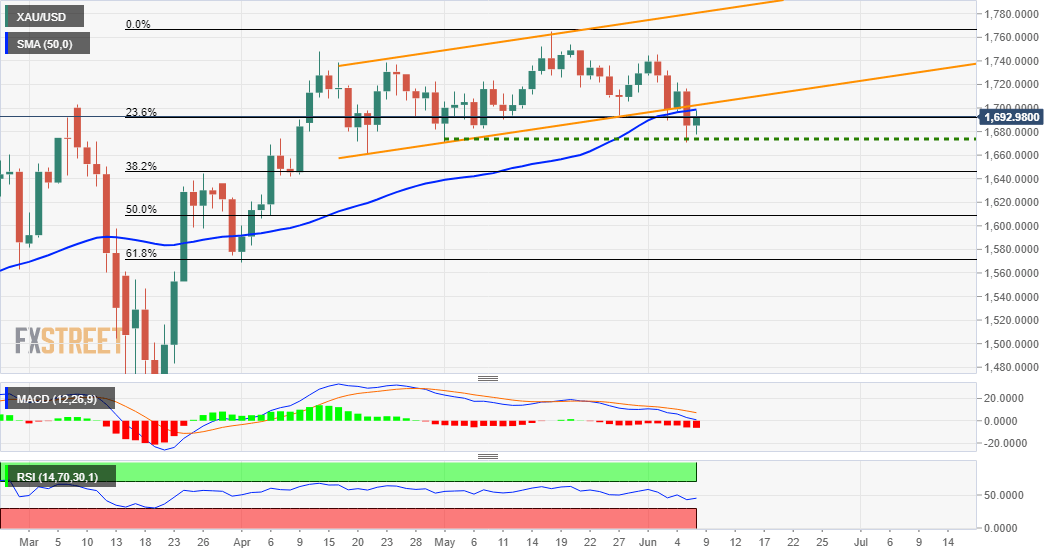
Meanwhile, the commodity last week's broke through a short-term ascending trend-channel. A subsequent acceptance below 50-day SMA confirmed a near-term bearish breakdown. This, in turn, warrants some caution before placing aggressive bullish bets or positioning for any further move up.

The negative outlook is further reinforced by the fact that technical indicators on the daily chart have just started drifting into the bearish territory. Hence, the uptick might still be seen as a selling opportunity near the $1700 mark and remain capped near the channel support breakpoint.

On the flip side, bears are likely to wait for some follow-through weakness below the $1670 level support, which if broken will set the stage for a slide towards the $1650 support. The downward momentum could further get extended towards the next major support near the $1635 region.

Gold daily chart

fxsoriginal

Technical levels to watch

XAU/USD

Overview
Today last price 1692.1
Today Daily Change 6.97
Today Daily Change % 0.41
Today daily open 1685.13
 
Trends
Daily SMA20 1722.01
Daily SMA50 1697.49
Daily SMA100 1642.4
Daily SMA200 1569.59
 
Levels
Previous Daily High 1716.59
Previous Daily Low 1670.76
Previous Weekly High 1745.12
Previous Weekly Low 1670.76
Previous Monthly High 1765.38
Previous Monthly Low 1670.72
Daily Fibonacci 38.2% 1688.27
Daily Fibonacci 61.8% 1699.08
Daily Pivot Point S1 1665.06
Daily Pivot Point S2 1645
Daily Pivot Point S3 1619.23
Daily Pivot Point R1 1710.89
Daily Pivot Point R2 1736.66
Daily Pivot Point R3 1756.72


Share: Feed news

Information on these pages contains forward-looking statements that involve risks and uncertainties. Markets and instruments profiled on this page are for informational purposes only and should not in any way come across as a recommendation to buy or sell in these assets. You should do your own thorough research before making any investment decisions. FXStreet does not in any way guarantee that this information is free from mistakes, errors, or material misstatements. It also does not guarantee that this information is of a timely nature. Investing in Open Markets involves a great deal of risk, including the loss of all or a portion of your investment, as well as emotional distress. All risks, losses and costs associated with investing, including total loss of principal, are your responsibility. The views and opinions expressed in this article are those of the authors and do not necessarily reflect the official policy or position of FXStreet nor its advertisers. The author will not be held responsible for information that is found at the end of links posted on this page.

If not otherwise explicitly mentioned in the body of the article, at the time of writing, the author has no position in any stock mentioned in this article and no business relationship with any company mentioned. The author has not received compensation for writing this article, other than from FXStreet.

FXStreet and the author do not provide personalized recommendations. The author makes no representations as to the accuracy, completeness, or suitability of this information. FXStreet and the author will not be liable for any errors, omissions or any losses, injuries or damages arising from this information and its display or use. Errors and omissions excepted.

The author and FXStreet are not registered investment advisors and nothing in this article is intended to be investment advice.

Recommended content


Recommended content

Editors’ Picks

EUR/USD extends gains above 1.0700, focus on key US data

EUR/USD extends gains above 1.0700, focus on key US data

EUR/USD meets fresh demand and rises toward  1.0750 in the European session on Thursday. Renewed US Dollar weakness offsets the risk-off market environment, supporting the pair ahead of the key US GDP and PCE inflation data. 

EUR/USD News

GBP/USD extends recovery above 1.2500, awaits US GDP data

GBP/USD extends recovery above 1.2500, awaits US GDP data

GBP/USD is catching a fresh bid wave, rising above 1.2500 in European trading on Thursday. The US Dollar resumes its corrective downside, as traders resort to repositioning ahead of the high-impact US advance GDP data for the first quarter. 

GBP/USD News

Gold price edges higher amid weaker USD and softer risk tone, focus remains on US GDP

Gold price edges higher amid weaker USD and softer risk tone, focus remains on US GDP

Gold price (XAU/USD) attracts some dip-buying in the vicinity of the $2,300 mark on Thursday and for now, seems to have snapped a three-day losing streak, though the upside potential seems limited. 

Gold News

Injective price weakness persists despite over 5.9 million INJ tokens burned

Injective price weakness persists despite over 5.9 million INJ tokens burned

Injective price is trading with a bearish bias, stuck in the lower section of the market range. The bearish outlook abounds despite the network's deflationary efforts to pump the price. 

Read more

US Q1 GDP Preview: Economic growth set to remain firm in, albeit easing from Q4

US Q1 GDP Preview: Economic growth set to remain firm in, albeit easing from Q4

The United States Gross Domestic Product (GDP) is seen expanding at an annualized rate of 2.5% in Q1. The current resilience of the US economy bolsters the case for a soft landing. 

Read more

Forex MAJORS

Cryptocurrencies

Signatures