|

Gold Price Analysis: Acceptance above $1985 critical to conquer $2000 – Confluence Detector

With the US dollar selling back on the cards, Gold’s quest for the $2000 level extends into August, as it consolidates the rebound to near $1980 region. The bulls continue to struggle at higher levels, with a convincing break to the upside awaited.

Record low US real yields and renewed US-China concerns will continue to bode well for the gold buyers while they eagerly await the developments surrounding the US fiscal stimulus package. Let’s see how the metal positioned technically, as it faces stiff resistance on its way to the key 2K mark.

Key XAU/USD resistances and supports

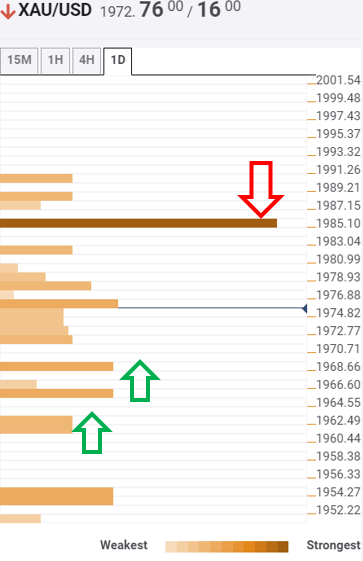
The tool shows that the bright metal is seen running into supply at $1980 in the immediate term. The level is the confluence of the Bollinger Band one-hour Upper, Fibonacci 38.2% one-day and previous high four-hour.

The next resistance is aligned at $1983, the Fibonacci 23.63% one-day. The spot needs to take out a powerful hurdle at $1985, in order to revive the bullish bias.

Alternatively, immediate support is placed at $1968, the convergence of SMA10 one-day and Bollinger Band four-hour Middle.

A failure to defend the latter, the next cushion of $1965 will offer some respite to the bulls. That is the Fibonacci 23.6% one-week support.          

Further down, a cluster of support levels awaits at $1960, the intersection of the pivot point one-day S1 and the previous day low.

Here is how it looks on the tool
fxsoriginal

About the Confluence Detector

The Confluence Detector finds exciting opportunities using Technical Confluences. The TC is a tool to locate and point out those price levels where there is a congestion of indicators, moving averages, Fibonacci levels, Pivot Points, etc. Knowing where these congestion points are located is very useful for the trader, and can be used as a basis for different strategies.

Learn more about Technical Confluence

Author

Dhwani Mehta

Dhwani Mehta

FXStreet

Residing in Mumbai (India), Dhwani is a Senior Analyst and Manager of the Asian session at FXStreet. She has over 10 years of experience in analyzing and covering the global financial markets, with specialization in Forex and commodities markets.


More from Dhwani Mehta
Share:

Editor's Picks

GBP/USD remains offered; bears target 1.3600

GBP/USD now leaves behind part of its recent recovery and revisits the low 1.3600s at the beginning of the week. Indeed, Cable trades with a mild downward bias amid decent gains in the Greenback as investors remain wary of upcoming US data releases and the Jackson Hole event.

EUR/USD remains sidelined above 1.1650

EUR/USD trades on the defensive following the closing bell on Wall Street on Monday, hovering around the 1.1660 region and adding to Friday’s small decline. The pair’s pullback comes in response to an acceptable rebound in the US Dollar in a context of generalised caution ahead of key US data releases and Chair Warsh’s speech in Jackson Hole.

Gold advances to over three-month high as bulls look to reclaim $4,700

Gold climbs to a fresh high since mid-May, with bulls now eyeing $4,700 and extending the rally witnessed since the beginning of this month. The US Treasury's bond market intervention failure fuels concerns about fiscal sustainability and boosts demand for bullion as an alternative store of value. Moreover, the US Dollar struggles to attract any meaningful buyers, which, along with receding bets for an immediate Fed rate hike, continues to benefit the non-yielding yellow metal.

XRP surged 72%, but is the rally really about XRP?
Ripple (XRP) surged more than 72% in less than a week, its strongest rally since July 2025, as cryptocurrency prices broadly broke out. But the move has a problem: it may have little to do with XRP itself. The token's near-term rally appears to have been driven largely by a broader liquidity shift after the US Treasury expanded long-end bond buybacks, pulling yields lower and lifting risk assets.
Convulsion in credit markets
The United States government just posted a $432.3 billion deficit for July, the largest monthly shortfall since March of 2021. That single burst of red ink pushed the yeartodate deficit to $1.8 trillion, with two months still remaining in fiscal 2026. At this pace, Washington will soon wax nostalgic for the “good old days” when annual deficits were only $2 trillion.
$20 billion offered, $2 billion taken: Why Treasury doubled its buyback cap

The US Treasury moved off its own calendar on Wednesday, and that is the part worth sitting with. At 12:32 GMT, the department said it would at least double the size of liquidity support buyback operations in the 10-year to 20-year and 20-year to 30-year sectors, lifting the maximum from $2 billion per operation to at least $4 billion, effective September 9 and running to November 4.














