|

Gold Price Analysis: 21-SMA on 4H limits the XAU/USD recovery ahead of US data

  • XAU/USD spots symmetrical triangle breakdown on the 1H chart.
  • RSI point south, within the bearish zone, allowing more declines.
  • Downside more compelling amid a bunch of healthy resistance levels.

Gold (XAU/USD) has returned to the red zone, as the US dollar appears to have found its feet after Tuesday’s corrective decline.

The US dollar is attempting a rebound despite the 0.50% advance in the S&P 500 futures, which reflects the risk-on market mood.

Gold traders await the key US ADP jobs and ISM Services PMI data for fresh directives. In the meantime, the yellow metal could likely remain at the mercy of the dollar dynamics.

From a short-term technical perspective, the bearish 21-simple moving average (SMA) at $1736 on the four-hour chart is capping the recovery attempts, at the moment.

The Relative Strength Index (RSI) has turned lower, suggesting that the recovery momentum could be losing steam.

Therefore, the eight-month lows of $1707 is back on the sellers’ radars.

Gold Price Chart: Four-hour 

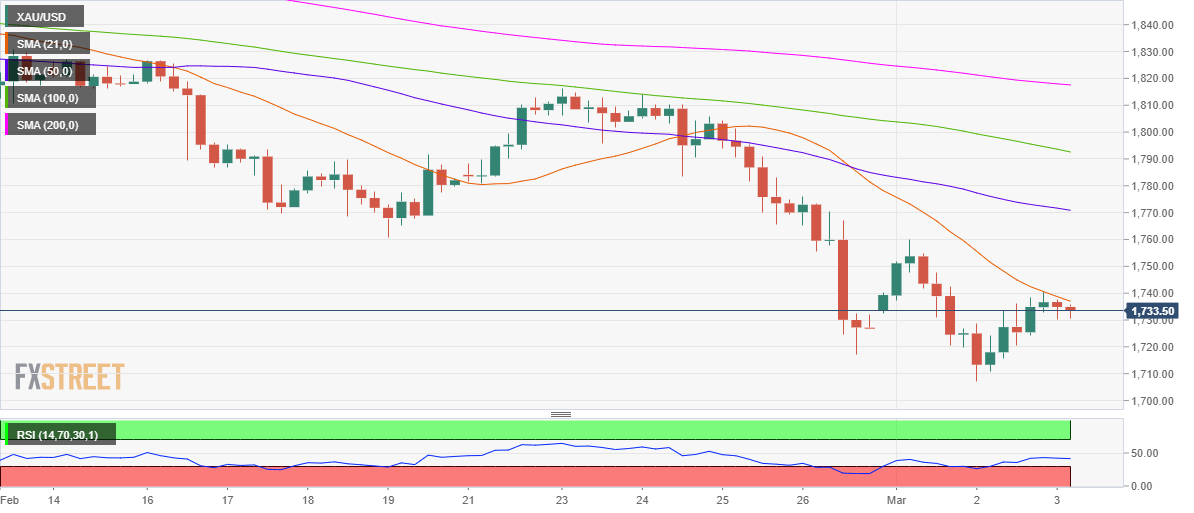
If the buyers manage to find acceptance above the 21-SMA barrier, the psychological $1750 level could be put to test.

Further up, the downward-sloping 50-SMA at $1771 would then challenge the bullish commitments.

Gold Additional levels

XAU/USD

Overview
Today last price1732.72
Today Daily Change-0.44
Today Daily Change %-0.03
Today daily open1733.16
 
Trends
Daily SMA201795.4
Daily SMA501839.57
Daily SMA1001854.61
Daily SMA2001860.36
 
Levels
Previous Daily High1738.56
Previous Daily Low1707.28
Previous Weekly High1816.07
Previous Weekly Low1717.24
Previous Monthly High1871.9
Previous Monthly Low1717.24
Daily Fibonacci 38.2%1726.61
Daily Fibonacci 61.8%1719.23
Daily Pivot Point S11714.11
Daily Pivot Point S21695.05
Daily Pivot Point S31682.83
Daily Pivot Point R11745.39
Daily Pivot Point R21757.61
Daily Pivot Point R31776.67

Author

Dhwani Mehta

Dhwani Mehta

FXStreet

Residing in Mumbai (India), Dhwani is a Senior Analyst and Manager of the Asian session at FXStreet. She has over 10 years of experience in analyzing and covering the global financial markets, with specialization in Forex and commodities markets.

More from Dhwani Mehta
Share:

Markets move fast. We move first.

Orange Juice Newsletter brings you expert driven insights - not headlines. Every day on your inbox.

By subscribing you agree to our Terms and conditions.

Editor's Picks

EUR/USD: Bulls pray for a dovish Fed

EUR/USD has finally taken a breather after a pretty energetic climb. The pair broke above 1.1680 in the second half of the week, reaching its highest levels in around two months before running into some selling pressure. Even so, it has gained almost two cents from the late-November dip just below 1.1500 the figure.

GBP/USD trims gains, recedes toward 1.3320

GBP/USD is struggling to keep its daily advance, coming under fresh pressure and retreating to the 1.3320 zone following a mild bullish attempt in the Greenback. Even though US consumer sentiment surprised to the upside, the US Dollar isn’t getting much love, as traders are far more interested in what the Fed will say next week.

Gold: Bullish momentum fades despite broad USD weakness

After rising more than 3.5% in the previous week, Gold has entered a consolidation phase and fluctuated at around $4,200. The Federal Reserve’s interest rate decision and revised Summary of Economic Projections, also known as the dot plot, could trigger the next directional move in XAU/USD. 

Week ahead: Rate cut or market shock? The Fed decides

Fed rate cut widely expected; dot plot and overall meeting rhetoric also matter. Risk appetite is supported by Fed rate cut expectations; cryptos show signs of life. RBA, BoC and SNB also meet; chances of surprises are relatively low. Dollar weakness could linger; both the aussie and the yen best positioned to gain further. Gold and oil eye Ukraine-Russia developments; a peace deal remains elusive.

The Silver disconnection is real

Silver just hit a new all-time high. Neither did gold, nor mining stocks. They all reversed on an intraday basis, but silver’s move to new highs makes it still bullish overall, while the almost complete reversals in gold and miners make the latter technically bearish.

Ripple faces persistent bear risks, shrugging off ETF inflows

Ripple is extending its decline for the second consecutive day, trading at $2.06 at the time of writing on Friday. Sentiment surrounding the cross-border remittance token continues to lag despite steady inflows into XRP spot ETFs.