Gold faces pressure just ahead of a fresh all-time high
- Gold is trading yet another leg higher again on Friday, after US President Trump’s reciprocal tariffs are set to come line in a few weeks time.
- Markets are starting to show fatigue with the Gold rally not looking that powerful.
- Gold is though still on track to at least test the all-time high at $2,942 on Friday.

Gold’s price (XAU/USD) is ticking higher and heads to $2,930 at the time of writing on Friday, holding good cards to close out this week with a new all-time high and solid gains. The latest leg up comes after United States (US) President Donald Trump signed the executive order for reciprocal tariffs on Thursday. Although it will still take weeks before tariffs are implemented, investors are not taking any chances and are parking their money in safe haven Gold.
Meanwhile, Gold added another tailwind to its rally, with a substantially weaker US Dollar (USD) and US Dollar Index (DXY) overall. The Greenback is losing traction because President Trump’s reciprocal tariffs need weeks or months before implementation. That opens the window of opportunity for negotiations, and hence, there is no immediate flight to a safe haven on the back of any announcement or signing of an executive order by the US President.
Daily digest market movers: What tariffs are left?
- Gold advances for a third day to trade near a record high after US President Donald Trump’s order for reciprocal tariffs against several nations increased uncertainty around trade and the global economy, Bloomberg reports.
- Bullion futures on Comex are trading at a substantial premium to spot. The most active contract is for April, and it is currently above $2,960. Meanwhile, cash is $30 lower, just below its all-time high, Reuters reports.
- At 13:30 GMT, January’s US Retail Sales data will be released. Expectations are for a 0.1% fall in Retail sales compared to the 0.4% increase in December.
Technical Analysis: It can only ease from here
Gold is set to hit a fresh all-time high just before the weekend. If the trend continues, it will be tough to fight it. However, a positive shift in geopolitics could move the needle and no longer warrant a higher Gold price.
The first support level on Friday is $2,919, which is the daily Pivot Point. From there, S1 support stands at $2,909. Further down, the S2 support at $2,890 should act as a safeguard and prevent any additional declines to the more significant $2,790 level (October 31, 2024, high).
On the upside, the R1 resistance at $2,938 is the first level that needs to be recovered, followed by the R2 resistance at $2,948. In case the rally continues, the $2,950 big figure will be tested for a break to the upside. Further up, the $3,000 psychological level could be next.
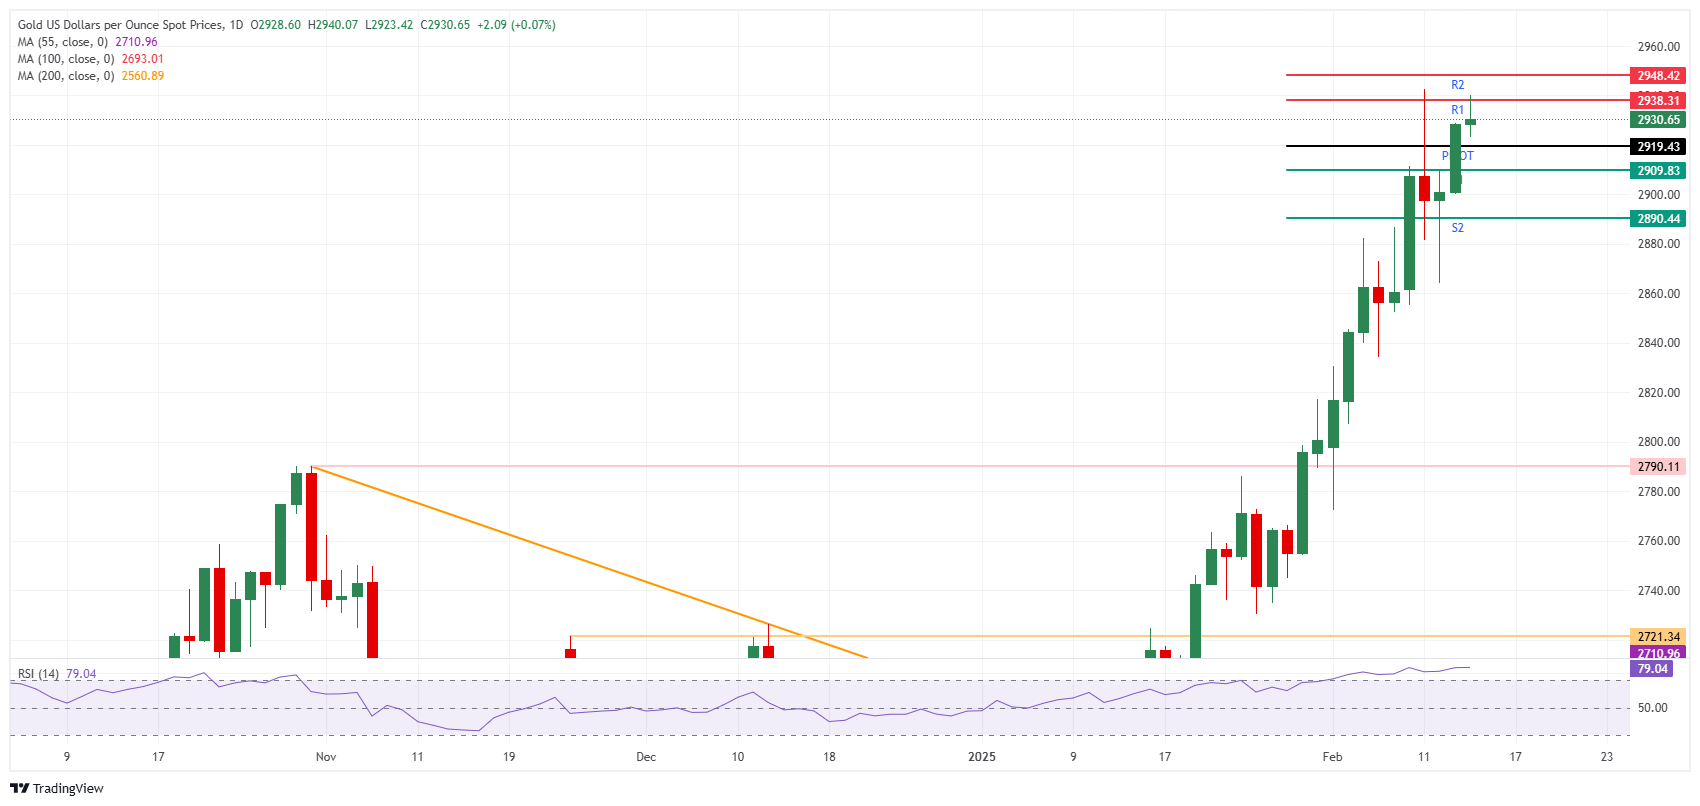
XAU/USD: Daily Chart
US-China Trade War FAQs
Generally speaking, a trade war is an economic conflict between two or more countries due to extreme protectionism on one end. It implies the creation of trade barriers, such as tariffs, which result in counter-barriers, escalating import costs, and hence the cost of living.
An economic conflict between the United States (US) and China began early in 2018, when President Donald Trump set trade barriers on China, claiming unfair commercial practices and intellectual property theft from the Asian giant. China took retaliatory action, imposing tariffs on multiple US goods, such as automobiles and soybeans. Tensions escalated until the two countries signed the US-China Phase One trade deal in January 2020. The agreement required structural reforms and other changes to China’s economic and trade regime and pretended to restore stability and trust between the two nations. However, the Coronavirus pandemic took the focus out of the conflict. Yet, it is worth mentioning that President Joe Biden, who took office after Trump, kept tariffs in place and even added some additional levies.
The return of Donald Trump to the White House as the 47th US President has sparked a fresh wave of tensions between the two countries. During the 2024 election campaign, Trump pledged to impose 60% tariffs on China once he returned to office, which he did on January 20, 2025. With Trump back, the US-China trade war is meant to resume where it was left, with tit-for-tat policies affecting the global economic landscape amid disruptions in global supply chains, resulting in a reduction in spending, particularly investment, and directly feeding into the Consumer Price Index inflation.
Author

Filip Lagaart
FXStreet
Filip Lagaart is a former sales/trader with over 15 years of financial markets expertise under its belt.


