|

Gold Miners Junior ETF (GDXJ) has resumed the rally higher

The VanEck Junior Gold Miners ETF (GDXJ) tracks small- and mid-cap gold and silver mining companies. Launched in 2009, it invests heavily in firms earning most of their revenue from mining or related activities. It appeals to investors seeking high-risk, high-reward exposure to precious metals. Below we will look at the Elliott Wave outlook of the ETF.

GDXJ monthly Elliott Wave view

Chart

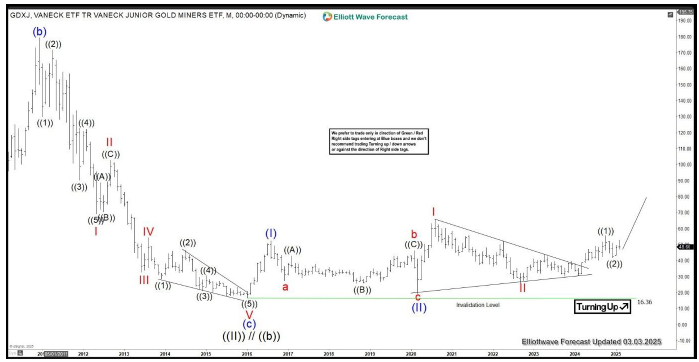
Monthly Elliott Wave Chart of GDXJ shows that the ETF made major low in 2016 at 16.36. We labelled this major bottom as wave ((II)). From there, the ETF rallied higher as a nest. Up from wave ((II), wave (I) ended at 52.5 and pullback in wave (II) ended at 19.52. The ETF nested higher in wave I at 65.95 and pullback in wave II ended at 25.8. Near term, while above 16.36, expect the ETF to extend higher.

GDXJ daily Elliott Wave view

Chart

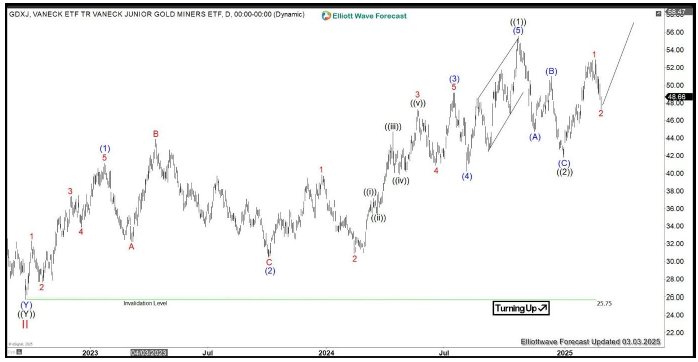
Daily Elliott Wave Chart of GDXJ shows dips to 25.79 ended wave II. The ETF then turned higher in wave III with internal subdivision as a 5 waves. Up from wave II, wave (1) ended at 41.16, and pullback in wave (2) ended at 30.46. The ETF resumed higher in wave (3) towards 49.13 and pullback in wave (4) ended at 40.26. Final leg wave (5) ended at 55.58 which completed wave ((1)) in higher degree. Pullback in wave ((2)) ended at 41.85 but the ETF needs to break above wave ((1)) to confirm the next leg higher has tarted. Near term, while above 25.75, expect the ETF to extend higher.

GDXJ four hour Elliott Wave view

Chart

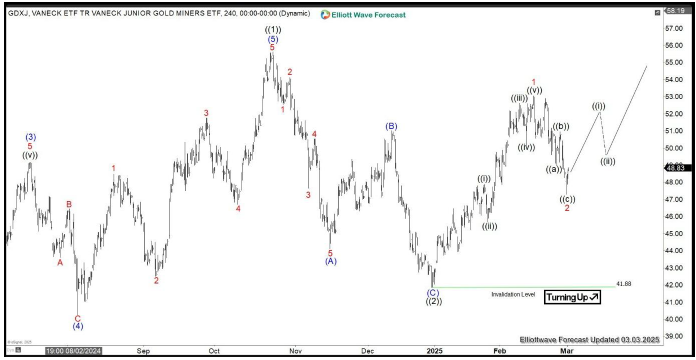
4 Hour Elliott Wave Chart of Gold Miners Junior ETF (GDXJ) above shows that cycle from 9.26.2022 low ended at 55.62 as wave ((1)). Pullback in wave ((2)) unfolded as a zigzag Elliott Wave structure. Down from wave ((1)), wave (A) ended at 44.11 and wave (B) ended at 51.03. Wave (C) lower ended at 41.88 which completed wave ((2)). The ETF has turned higher in wave ((3)). Up from wave ((2)), wave 1 ended at 53.05 and pullback in wave 2 ended at 47.29. Near term, while above 41.88, expect the ETF to extend higher.

GDXJ Elliott Wave video

Author

Elliott Wave Forecast Team

Elliott Wave Forecast Team

ElliottWave-Forecast.com

More from Elliott Wave Forecast Team
Share:

Editor's Picks

AUD/USD falls to near 0.7100 after slipping below 50-day EMA

AUD/USD depreciates after registering minor gains in the previous day, trading around 0.7120 during the Asian hours. The technical analysis of the daily chart shows the pair consolidating sideways within a rectangle pattern, as neither bulls nor bears gain control. The AUD/USD pair is holding a slight bearish tone however as it sits beneath both the nine-day and 50-day EMAs.

160.00: USD/JPY back near intervention territory after upbeat US jobs report

US Nonfarm Payrolls beat expectations by a wide margin in May, with 172K jobs added. The US Dollar rebounds after the release, helping USD/JPY recover from its intraday lows. Warnings from Japanese authorities continue to limit upside potential near the 160.00 threshold.

Gold targets $4,300 amid stronger Dollar

Gold faces increasing selling interest and navigates the area of three-month lows near the $4,300 mark per troy ounce on Friday. The precious metal’s decline comes as traders assess the stronger-than-expected NFP, while the bid bias in the Greenback and higher US Treasury yields also collaborate with the retracement.

Cardano hits five-year low even as Hoskinson clarifies "break" isn't an exit

Cardano (ADA) price is down 10% at press time on Friday, extending losses over 30% so far this week amid Charles Hoskinson's clarification that "break" isn't an exit.

Week ahead – Fed countdown begins amid US inflation data and geopolitical risks

Fed Chair Warsh’s first meeting approaches as key US inflation data could reshape expectations. Oil prices remain elevated as US-Iran talks continue; tariffs also return to the spotlight. ECB is expected to hike; will it be a one-off move or is July live?

The US economy defies the rules: 100 days into the Oil shock and the recession signal is still missing

More than three months after the start of the Iran war and the resulting disruption to global energy markets, the US economy continues to display remarkable resilience. The conflict has triggered a sharp rise in Oil prices, reignited inflationary pressures and fueled widespread concerns about a potential economic slowdown.