Gold extends shallow pullback as traders await US PMI data
- Gold takes a pause in its rally ahead of key PMI data and speeches at the Jackson Hole central banker symposium.
- Weak US data signals an imminent fall in US interest rates and continues to be broadly supportive of Gold.
- Technically, XAU/USD still has not reached its minimum upside target after its breakout from the range.

Gold (XAU/USD) trades just above $2,500 after extending a modest pullback on Thursday. US yields are bouncing back into the green and the US Dollar (USD) – to which Gold is negatively correlated – inches back into positive territory after falling to year-to-date lows early Wednesday.
US employment data has come in mixed. US Initial Jobless Claims shows a higher-than-expected 232K claims in the week of August 14, when economists had expected only 230K from an upwardly-revised 228K in the previous week. Continuing Jobless Claims, however, came in below expectations at 1.863 million from a revised-down 1.859M in the previous week and below the 1.8700 forecast, said data from the US Department of Labor on Thursday.
Gold broadly supported by negative US data
Gold traders continue to assess the outlook for the US economy for guidance on the future path of interest rates, a key driver for the asset. Gold tends to appreciate as interest rates fall because this lowers the opportunity cost of holding the non-interest paying asset.
The release of the Federal Reserve’s (Fed) July meeting minutes on Wednesday revealed a greater willingness on the part of Fed members to cut interest rates. Some members even saw a 0.25% cut as plausible in July despite eventually voting against such a move. The majority saw a cut in interest rates as necessary in September if macroeconomic data continued its current trend. Overall, the Minutes solidified expectations of a September rate cut. However, given the market has already fully priced in the probability of at least a 0.25% cut, the Minutes had little impact on asset prices.
The chances of a “mega cut” of 0.50% at the September meeting have edged up again over recent sessions and at the time of publication stand at 34.5% compared to the 28.5% a few days ago, according to data from the CME FedWatch Tool. Whether this could materialize is of interest to traders since a 0.25% cut is now a fait accompli. Whether Gold presses higher again may greatly depend on whether the Fed in fact goes ahead with the larger 0.5% reduction in interest rates.
Given recent jitters about the state of the US labor market, the other key data out on Wednesday was the US Bureau of Labour Statistics (BLS) preliminary revisions to Nonfarm Payrolls (NFP) data for the 12 months to March 2024. These showed an aggregate downward revision of 818,000, which translates into an average of 68,000 fewer payrolls per month, bringing the average pace down from 242,000 per month to 174,000 instead. Although substantially lower, the data isn’t bad enough to flash recession-warning signs, and besides, as Jim Reid, a strategist at Deutsche Bank notes, “the revisions only affect the numbers up to March, and don’t change our understanding of the more recent figures, which is ultimately what the Fed cares about.”
That said, the poor data still adds to the narrative of a weakening labor market, adding further pressure on US yields, the US Dollar, and is broadly supportive of Gold.
US S&P Global preliminary Purchasing Manager Index (PMI) data for August, which gauges activity levels in key industry sectors, is the main data point to watch on Thursday. The speech by Fed Chairman Jerome Powell at the central-banker moot in Jackson Hole will be the major event for Gold bugs on Friday.
Technical Analysis: Gold extends shallow pullback
Gold (XAU/USD) extends a shallow pullback after rolling over from new all-time highs. The short-term trend, however, remains bullish and given “the trend is your friend” this continues to favor longs over shorts.
The breakout of the range on August 14 generated an upside target at roughly $2,550, calculated using the usual method of taking the 0.618 Fibonacci ratio of the range’s height and extrapolating it higher. The target is a minimum expectation based on technical analysis.
XAU/USD Daily Chart
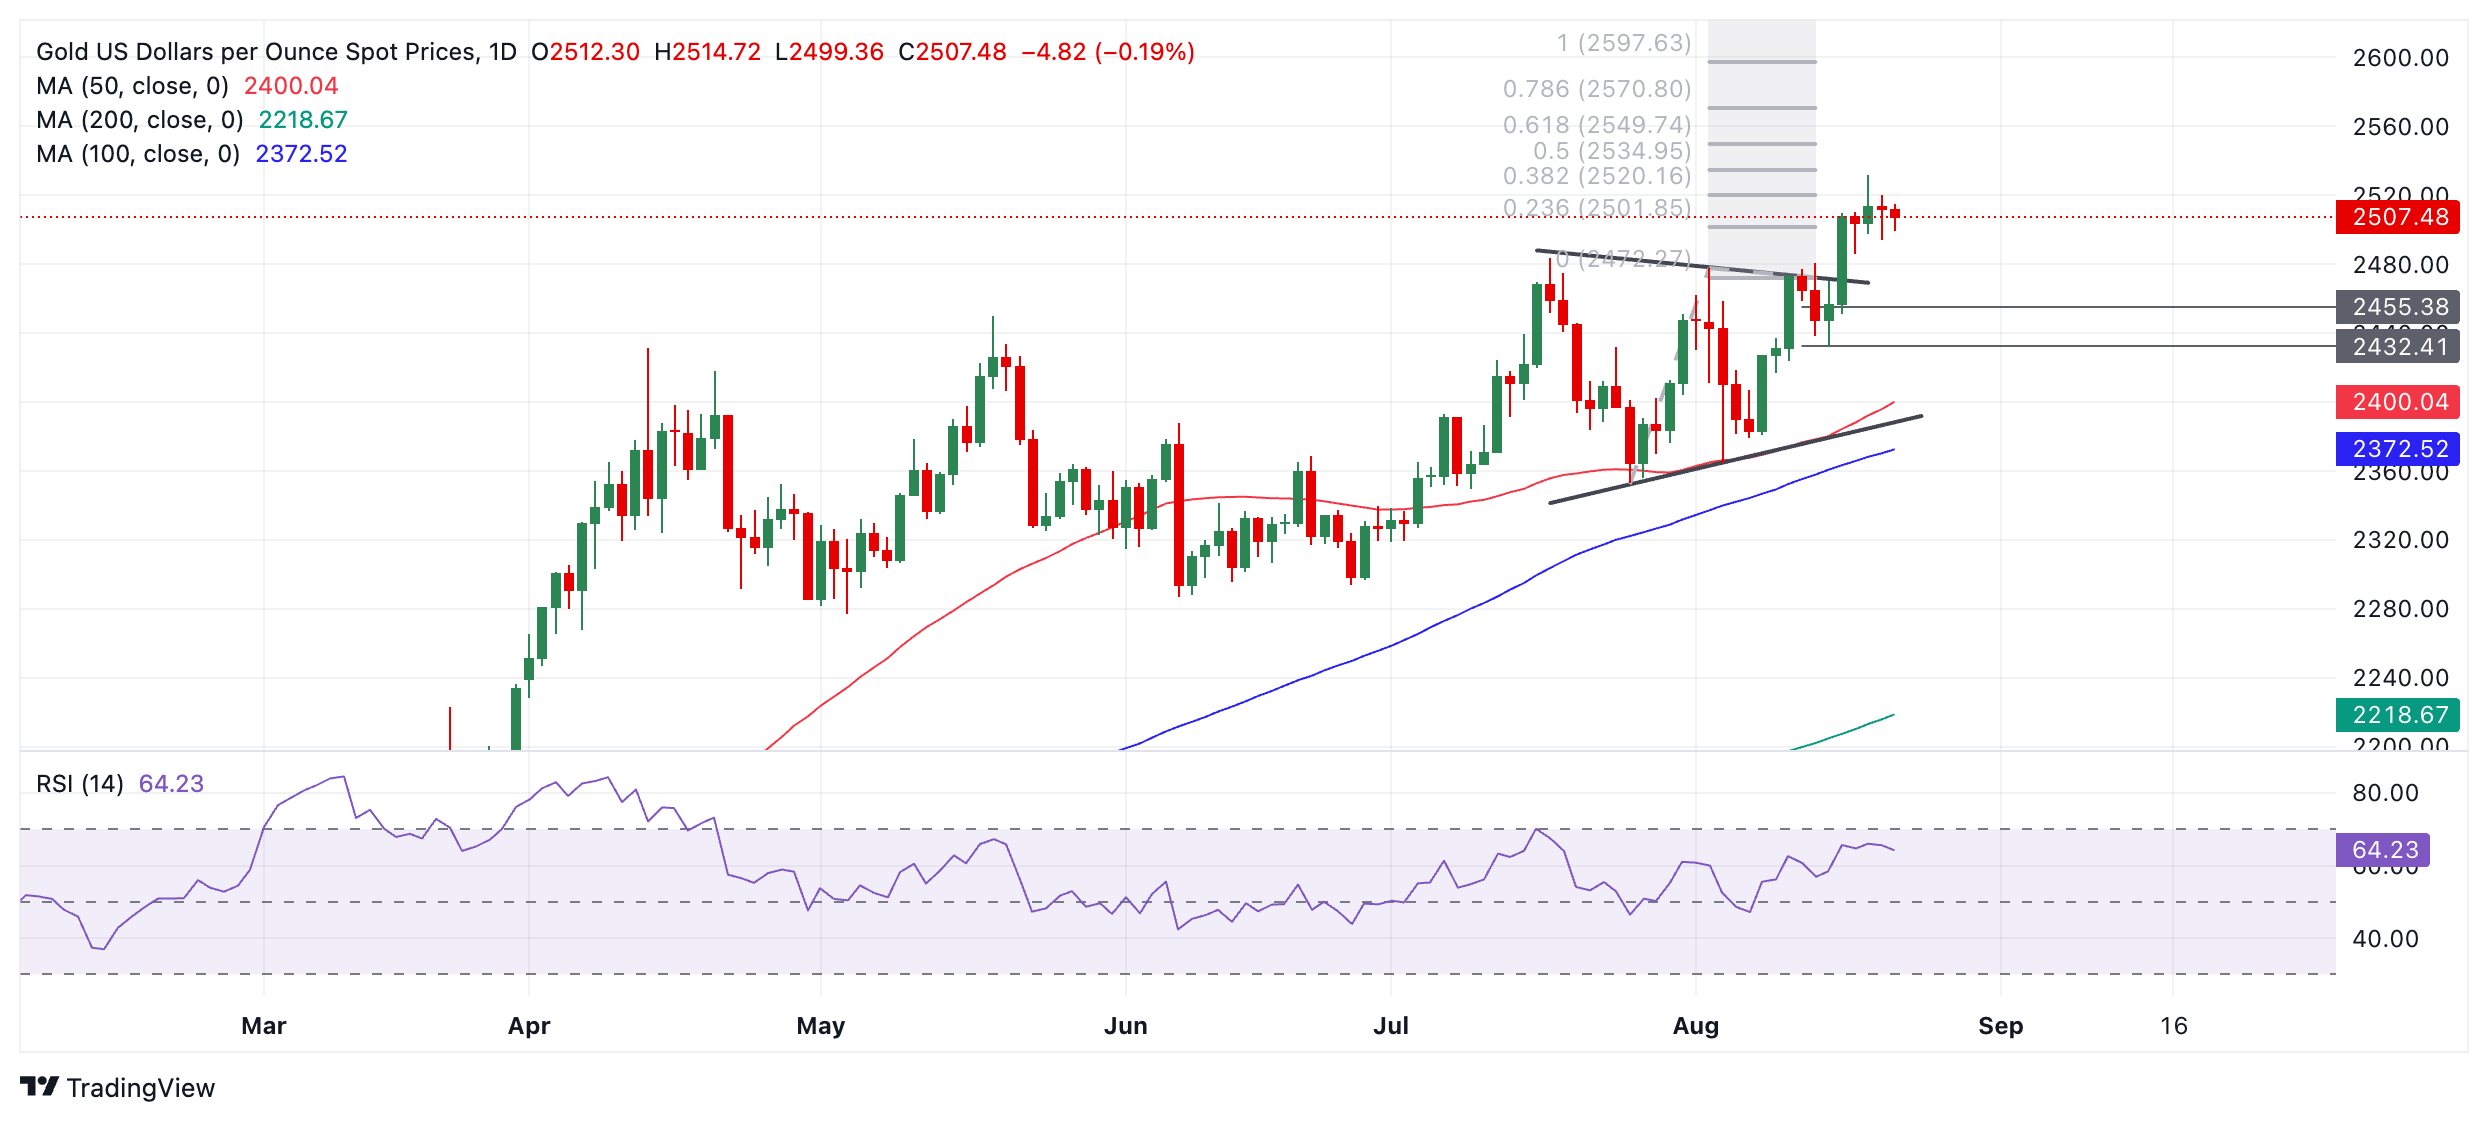
Gold is in a broad uptrend on medium and long-term time frames, which further supports an overall bullish outlook for the precious metal.
Economic Indicator
Initial Jobless Claims
The Initial Jobless Claims released by the US Department of Labor is a measure of the number of people filing first-time claims for state unemployment insurance. A larger-than-expected number indicates weakness in the US labor market, reflects negatively on the US economy, and is negative for the US Dollar (USD). On the other hand, a decreasing number should be taken as bullish for the USD.
Read more.Last release: Thu Aug 22, 2024 12:30
Frequency: Weekly
Actual: 232K
Consensus: 230K
Previous: 227K
Source: US Department of Labor
Every Thursday, the US Department of Labor publishes the number of previous week’s initial claims for unemployment benefits in the US. Since this reading could be highly volatile, investors may pay closer attention to the four-week average. A downtrend is seen as a sign of an improving labour market and could have a positive impact on the USD’s performance against its rivals and vice versa.
Author

Joaquin Monfort
FXStreet
Joaquin Monfort is a financial writer and analyst with over 10 years experience writing about financial markets and alt data. He holds a degree in Anthropology from London University and a Diploma in Technical analysis.

















