Gold recovers earlier losses as USD weakens
- Gold recoups earlier losses as US Dollar continues weakening, safe-haven demand.
- Gold imports to China, its largest market, fell by 38% in April.
- XAU/USD is probably forming a Bear Flag continuation pattern.

Gold (XAU/USD) recovers earlier losses and is trading in the $2,350s on Tuesday during the US session, as the US Dollar weakens and sentiment takes a negative turn – a positive for safe-haven Gold.
The precious metal recoups earlier losses on the back of concerns that demand in China – Gold’s largest market – might be fading.
Gold imports to China fall
Gold imports to China via Hong Kong fell 38% in April compared to the previous month, according to data from the Hong Kong Census and Statistics Department, released on Monday.
Net imports into the world's largest Gold consumer totaled 34.6 metric tons in April, compared to 55.8 tonnes in March, the data showed.
Gold stored in Hong Kong International Airport accounts for the lion’s share of the Gold that is imported into mainland China. The commodity is mainly moved from one country to another principally by air so it gets stored at Hong Kong Airport before making the last leg of its journey across the border into China.
The data marks a change from the high consumption recorded in China, in the first quarter, which showed a 5.94% rise from a year earlier, according to data from the China Gold Association (CGA). 308.91 metric tons of the precious metal were consumed by China-based buyers in the first three months of the year, the China Daily reported.
Technical Analysis: Gold might be forming a Bear Flag
Gold price is consolidating in a rectangular formation (red-shaded area) after its steep decline from the dizzy heights reached last week. The sell-off has taken XAU/USD below a major trendline, ushering in a new more bearish technical environment for the precious metal.
The result is that Gold is probably in a short-term downtrend now, favoring short positions over longs.
XAU/USD 4-hour Chart
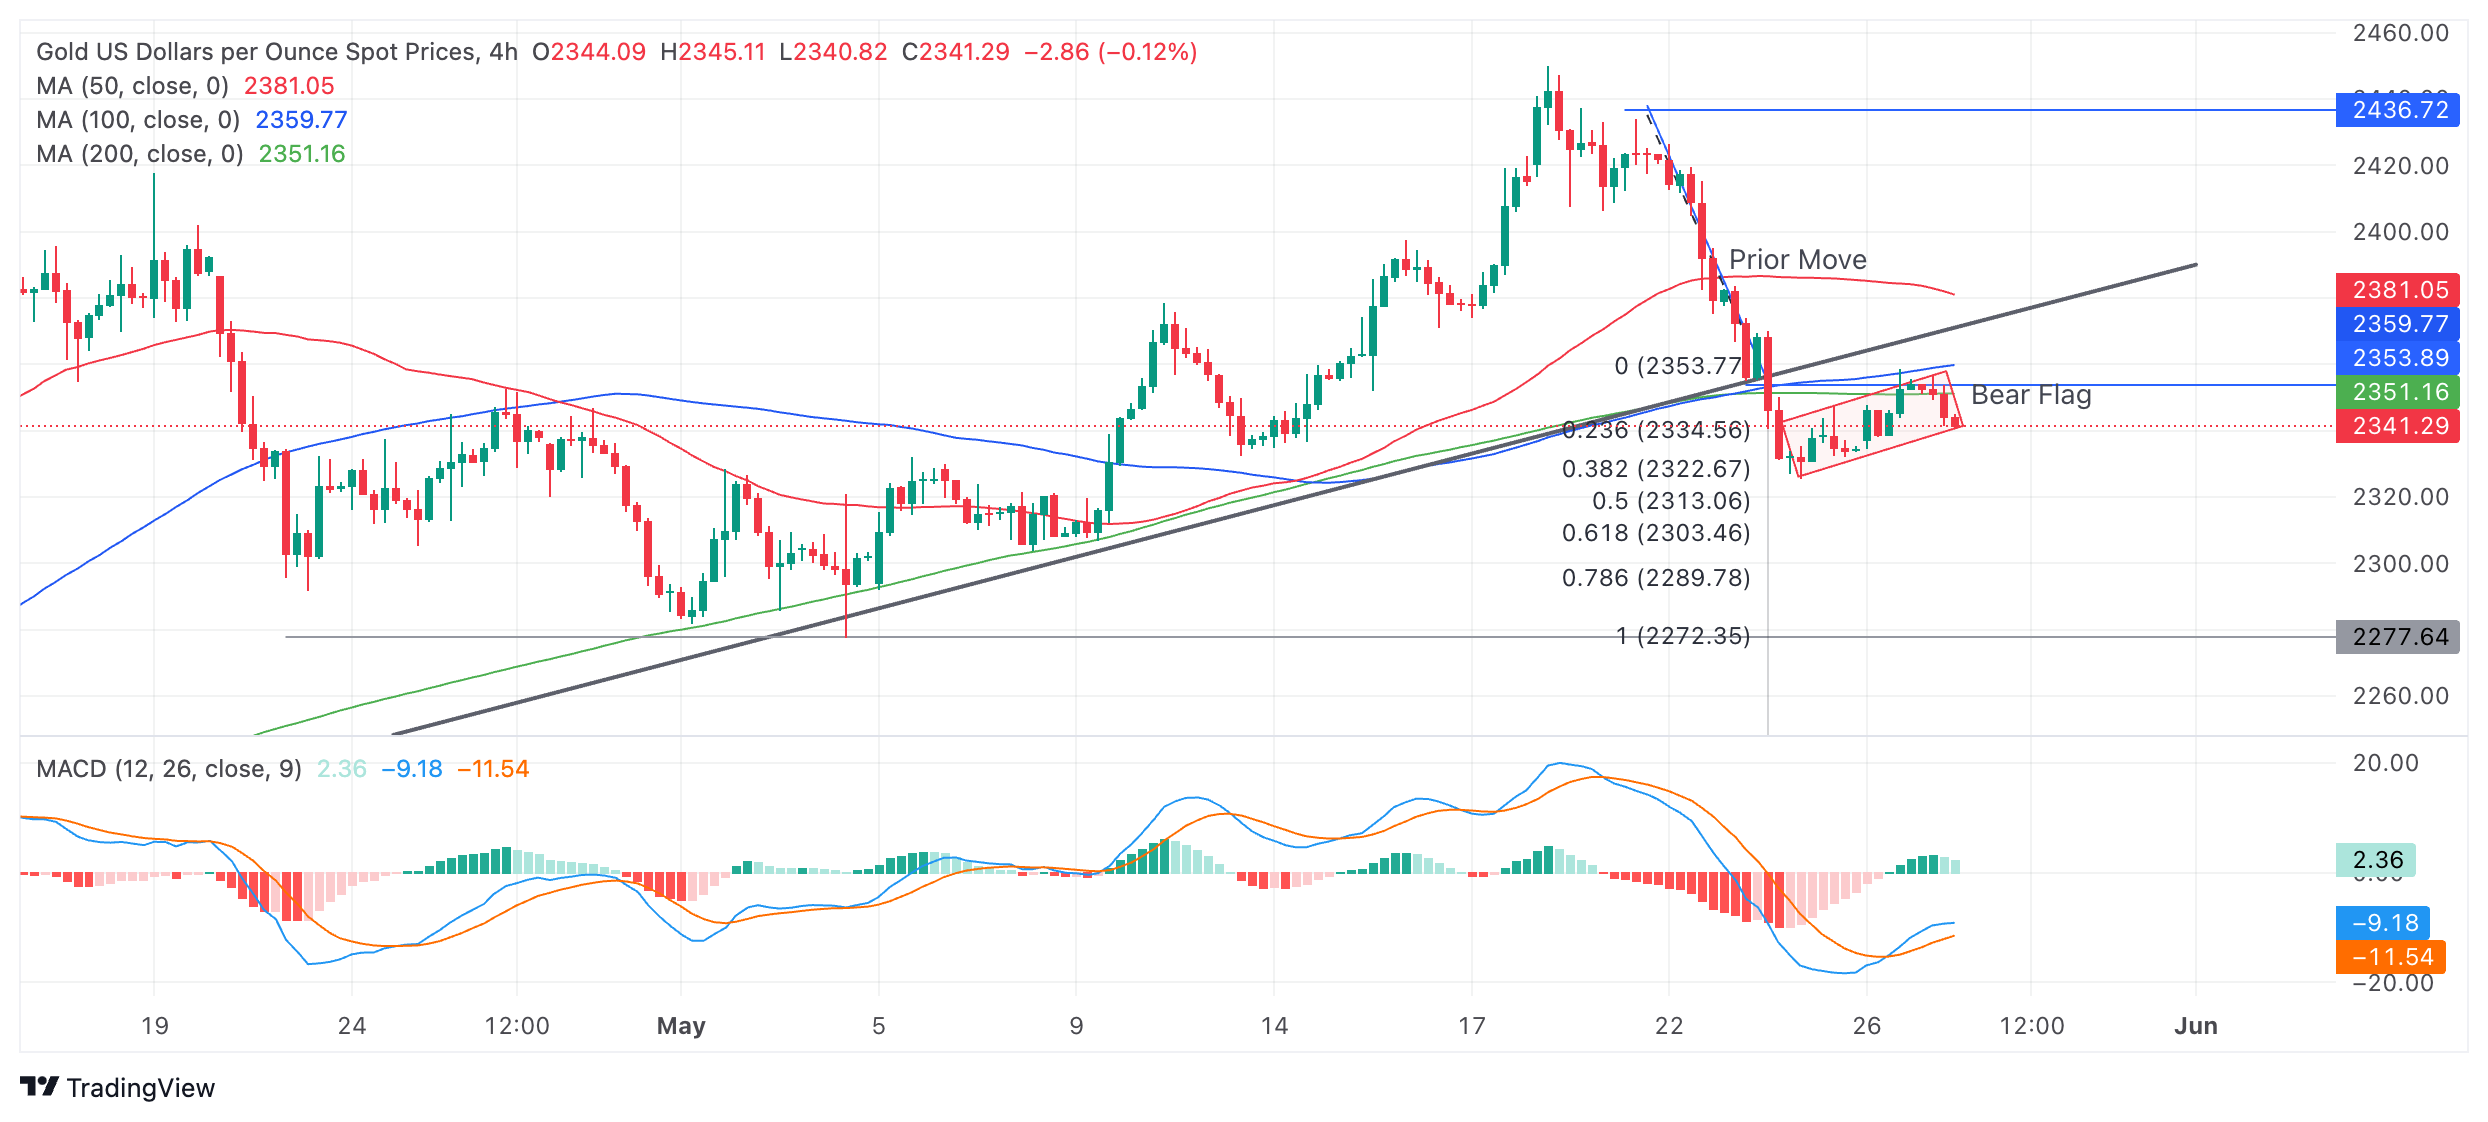
The precious metal has pulled back since bottoming on May 24 but it looks vulnerable to breaking down. The pullback might be a Bear Flag continuation price pattern. If so, it would suggest substantial downside – to at least $2,300 – in the event of a break below the $2,325 May 24 lows.
Last week’s decisive break of the major trendline indicates a likely follow-through lower. The conservative target for the follow-through is $2,303 (the Fibonacci 0.618 extrapolation of the down move prior to the break – from $2,435 to $2,355).
A more bearish move could see Gold fall all the way down to $2,272 (the 100% extrapolation of the move prior to the break). The latter level is also the support from the May 3 lower high. A break below the $2,325 lows would provide confirmation of more downside to these targets.
The Moving Average Convergence Divergence (MACD) indicator crossed above its signal line on Monday, and the pullback continued developing in line with the signal from the indicator. However, it has weakened again on Tuesday and is currently pressuring the base of the rectangle.
The precious metal’s medium and long-term trends are still bullish, suggesting the risk of a recovery remains high, yet price action is not supporting a resumption hypothesis.
A decisive break back above the trendline, now at $2,375, would provide evidence of a recovery and reversal of the short-term downtrend.
A decisive break would be one accompanied by a long green bullish candle or three green candles in a row.
Gold FAQs
Gold has played a key role in human’s history as it has been widely used as a store of value and medium of exchange. Currently, apart from its shine and usage for jewelry, the precious metal is widely seen as a safe-haven asset, meaning that it is considered a good investment during turbulent times. Gold is also widely seen as a hedge against inflation and against depreciating currencies as it doesn’t rely on any specific issuer or government.
Central banks are the biggest Gold holders. In their aim to support their currencies in turbulent times, central banks tend to diversify their reserves and buy Gold to improve the perceived strength of the economy and the currency. High Gold reserves can be a source of trust for a country’s solvency. Central banks added 1,136 tonnes of Gold worth around $70 billion to their reserves in 2022, according to data from the World Gold Council. This is the highest yearly purchase since records began. Central banks from emerging economies such as China, India and Turkey are quickly increasing their Gold reserves.
Gold has an inverse correlation with the US Dollar and US Treasuries, which are both major reserve and safe-haven assets. When the Dollar depreciates, Gold tends to rise, enabling investors and central banks to diversify their assets in turbulent times. Gold is also inversely correlated with risk assets. A rally in the stock market tends to weaken Gold price, while sell-offs in riskier markets tend to favor the precious metal.
The price can move due to a wide range of factors. Geopolitical instability or fears of a deep recession can quickly make Gold price escalate due to its safe-haven status. As a yield-less asset, Gold tends to rise with lower interest rates, while higher cost of money usually weighs down on the yellow metal. Still, most moves depend on how the US Dollar (USD) behaves as the asset is priced in dollars (XAU/USD). A strong Dollar tends to keep the price of Gold controlled, whereas a weaker Dollar is likely to push Gold prices up.
Author

Joaquin Monfort
FXStreet
Joaquin Monfort is a financial writer and analyst with over 10 years experience writing about financial markets and alt data. He holds a degree in Anthropology from London University and a Diploma in Technical analysis.


