Gold rolls over and sinks 1.5% after reaching milestone high
- Gold plummets after topping at a new record high of $2,790 on Thursday.
- The yellow metal sees downside pressure from rising US Treasury bond yields following stronger US employment data.
- Hopes of a Middle East ceasefire and the probability of a Trump victory are also weighing on Gold.

Gold (XAU/USD) declines over one-and-a-half percentage points on Thursday after reaching a new record high of $2,790. The precious metal is trading lower in the $2,740s partly due to rising US Treasury bond yields and a stronger US Dollar (USD). Higher yields reflect elevated interest rate expectations which, in turn, have reduced the attractiveness of non-interest-paying assets such as Gold.
Strong US ADP employment data on Wednesday helped provide an antidote to the weak US JOLTS Job Openings data released earlier in the week because it suggested the US labor market was not in as bad shape as feared. This was further backed up by the release of lower-than-expected US Initial Jobless Claims figures on Thursday which showed 216K people claimed unemployment relief in the week ending October 25. This was below the upwardly-revised 238K of the previous week and expectations of 230K.
The healthier labor market data is reducing bets the Federal Reserve (Fed) will need to slash interest rates to boost employment. The market-based probabilities, using the price of interest-rate swaps as a guide, forecasts an almost 100% chance of a 25 basis point (bps) or 0.25% cut by the Fed in November but a 70% probability in December.
Bond yields might be further rising because of the increasing odds of the Republican nominee Donald Trump winning the race to the White House. Trump’s preference for lower taxes, higher government borrowing and tariffs on foreign imports would probably be inflationary for the economy and lead the Fed to keep interest rates higher for longer.
This, and the emergence of a glimmer of hope on the horizon for a ceasefire in the Middle East – thereby lowering safe-haven demand for the yellow metal – is creating a headwind for Gold price in its onward march higher.
Gold falls as bearish factors coalesce
Gold price is also tumbling because the chances of a Trump presidency have steadily increased.
Polling website FiveThirtyEight’s prediction model gives Trump a 52% chance of winning versus Vice President Kamala Harris’ 48%. Betting website OddsChecker offers fractional odds of 11/18 (or 62.1%) for a Trump win against 28/17 (or 37.8%) for a Kamala Harris victory. The latest opinion polls, however, still place Harris marginally in the lead with 48.1% versus 46.7% for Trump.
In addition, Gold may be falling on reduced safe-haven flows amid hopes of a ceasefire in the Middle East. The US has sent a new envoy to broker a peace deal between Israel Hamas and Hezbollah. Early signs suggest Israel is open to negotiation after successfully pushing back Hezbollah from southern Lebanon, decapitating its hierarchy and severely reducing Hamas’ capabilities in Gaza, according to Bloomberg News. The threat of Iran opening a direct front against Israel, however, remains a potential spoiler.
That said, the war in Ukraine continues to fuel geopolitical risks after the escalation of North Korean troops entering the war on the side of Russia.
Technical Analysis: Gold rolls over after breaking to new highs
Gold is declining after rising up to a new all-time high of $2,790. Despite recent weakness, the yellow metal's uptrend remains intact. It is in a steady uptrend on all time frames (short, medium and long), which, given the technical principle that “the trend is your friend,” tilts the odds in favor of more upside.
XAU/USD Daily Chart
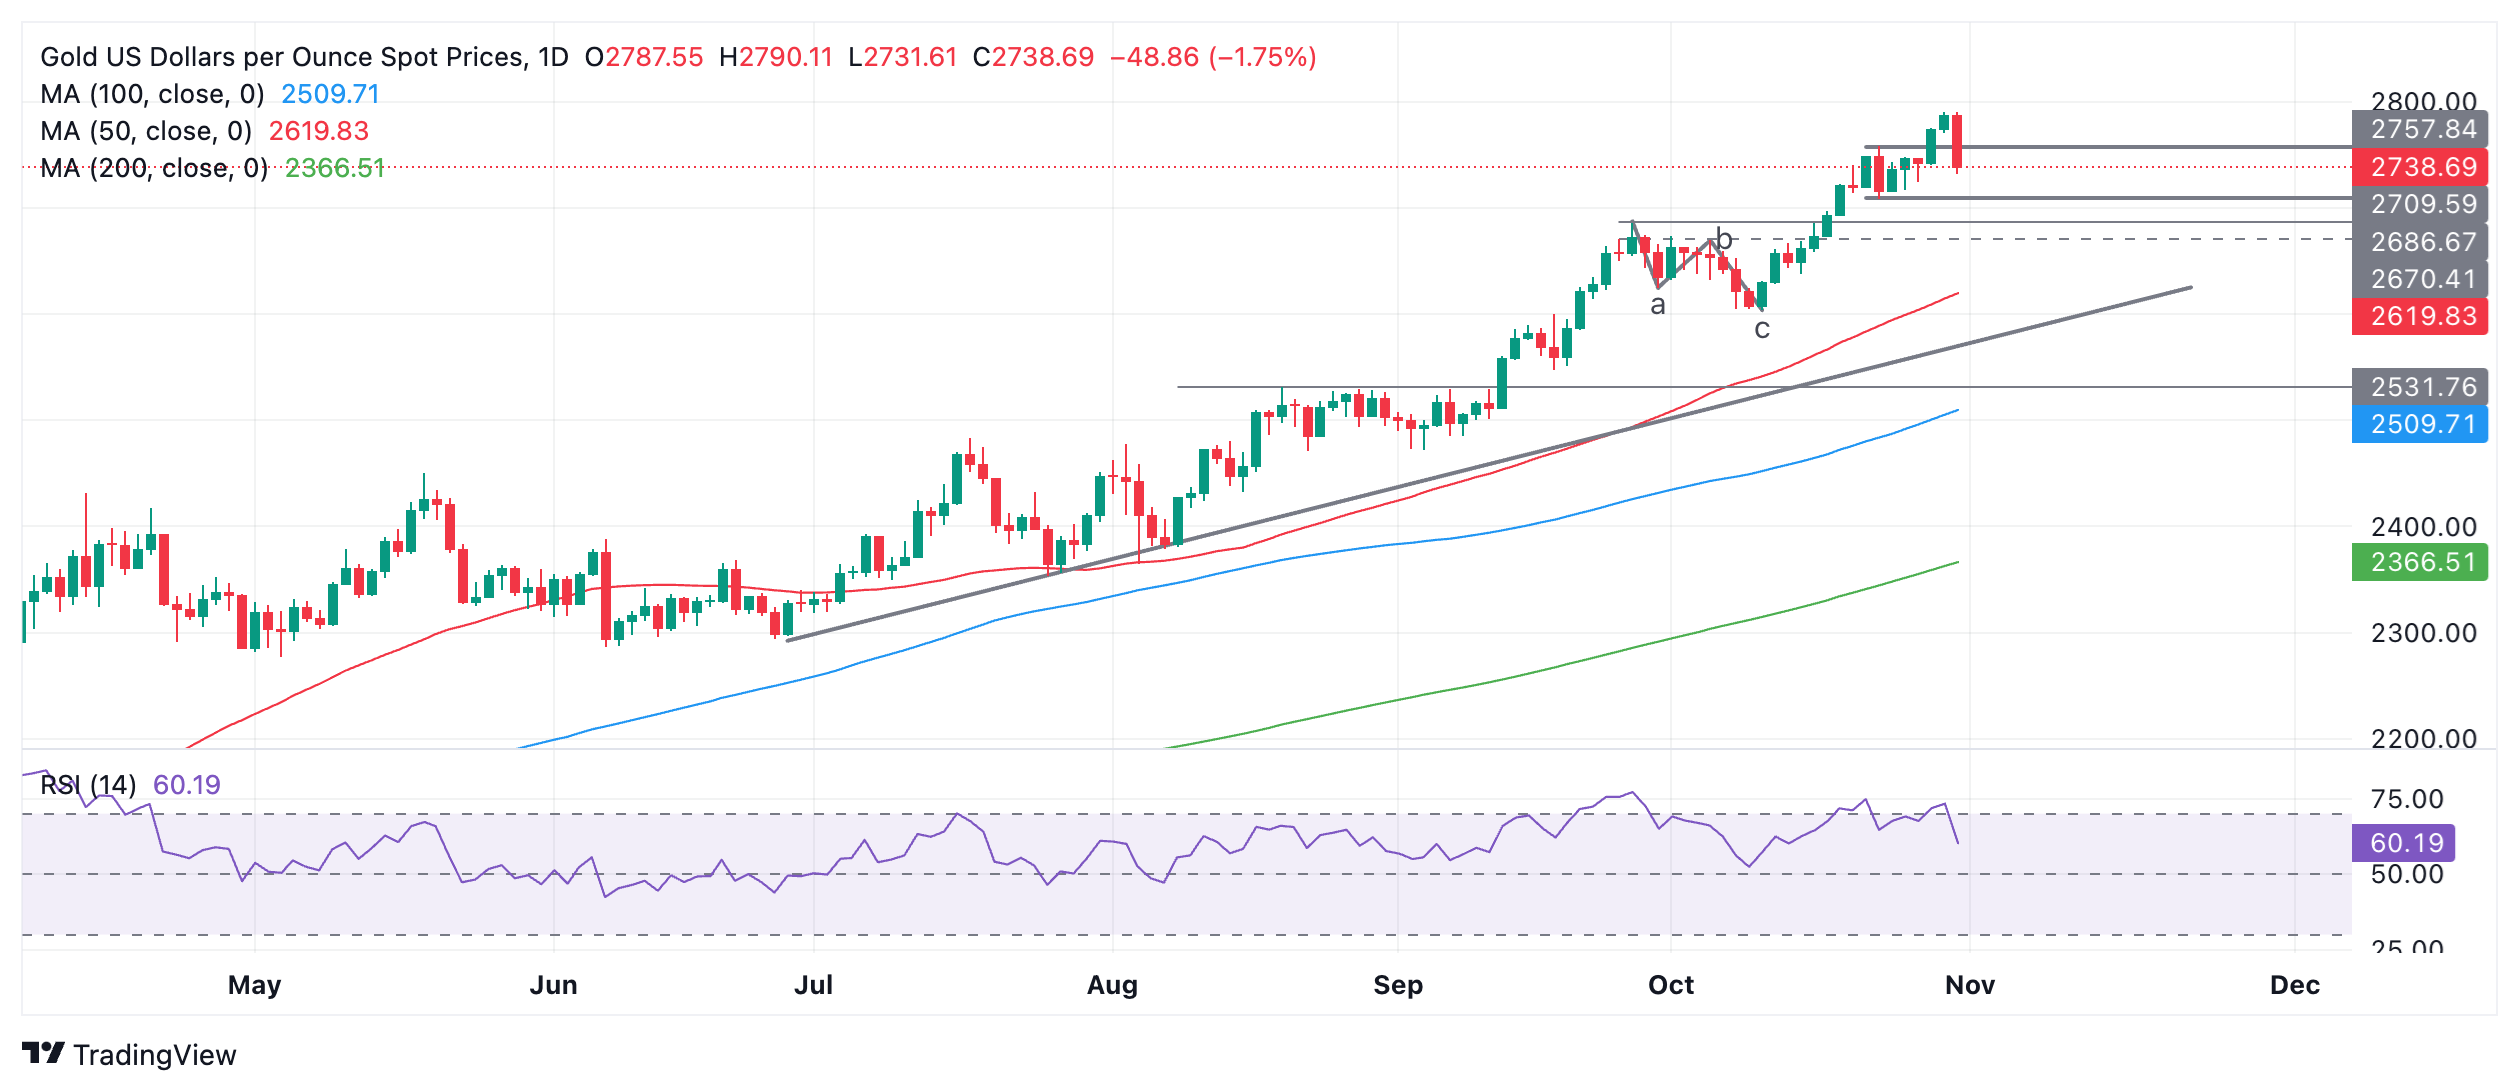
The break above the top of the range helps confirm a continuation up to the next target level, probably at the big-figure $3,000 level (round number and psychological level).
The pullback has already broken below support at $2,758 and $2,750. A deeper correction could find further support at the $2,707 range lows.
A break above $3,000, however, would activate the next upside target at $3,050.
Economic Indicator
Initial Jobless Claims
The Initial Jobless Claims released by the US Department of Labor is a measure of the number of people filing first-time claims for state unemployment insurance. A larger-than-expected number indicates weakness in the US labor market, reflects negatively on the US economy, and is negative for the US Dollar (USD). On the other hand, a decreasing number should be taken as bullish for the USD.
Read more.Last release: Thu Oct 31, 2024 12:30
Frequency: Weekly
Actual: 216K
Consensus: 230K
Previous: 227K
Source: US Department of Labor
Every Thursday, the US Department of Labor publishes the number of previous week’s initial claims for unemployment benefits in the US. Since this reading could be highly volatile, investors may pay closer attention to the four-week average. A downtrend is seen as a sign of an improving labour market and could have a positive impact on the USD’s performance against its rivals and vice versa.
Author

Joaquin Monfort
FXStreet
Joaquin Monfort is a financial writer and analyst with over 10 years experience writing about financial markets and alt data. He holds a degree in Anthropology from London University and a Diploma in Technical analysis.


