|

Gold Asia Price Forecast: XAU/USD holds near $1690/oz, bullish

  • XAU/USD remains sidelined near the 1690/1700 support zone. 
  • The level to beat for buyers is the 1740 resistance.


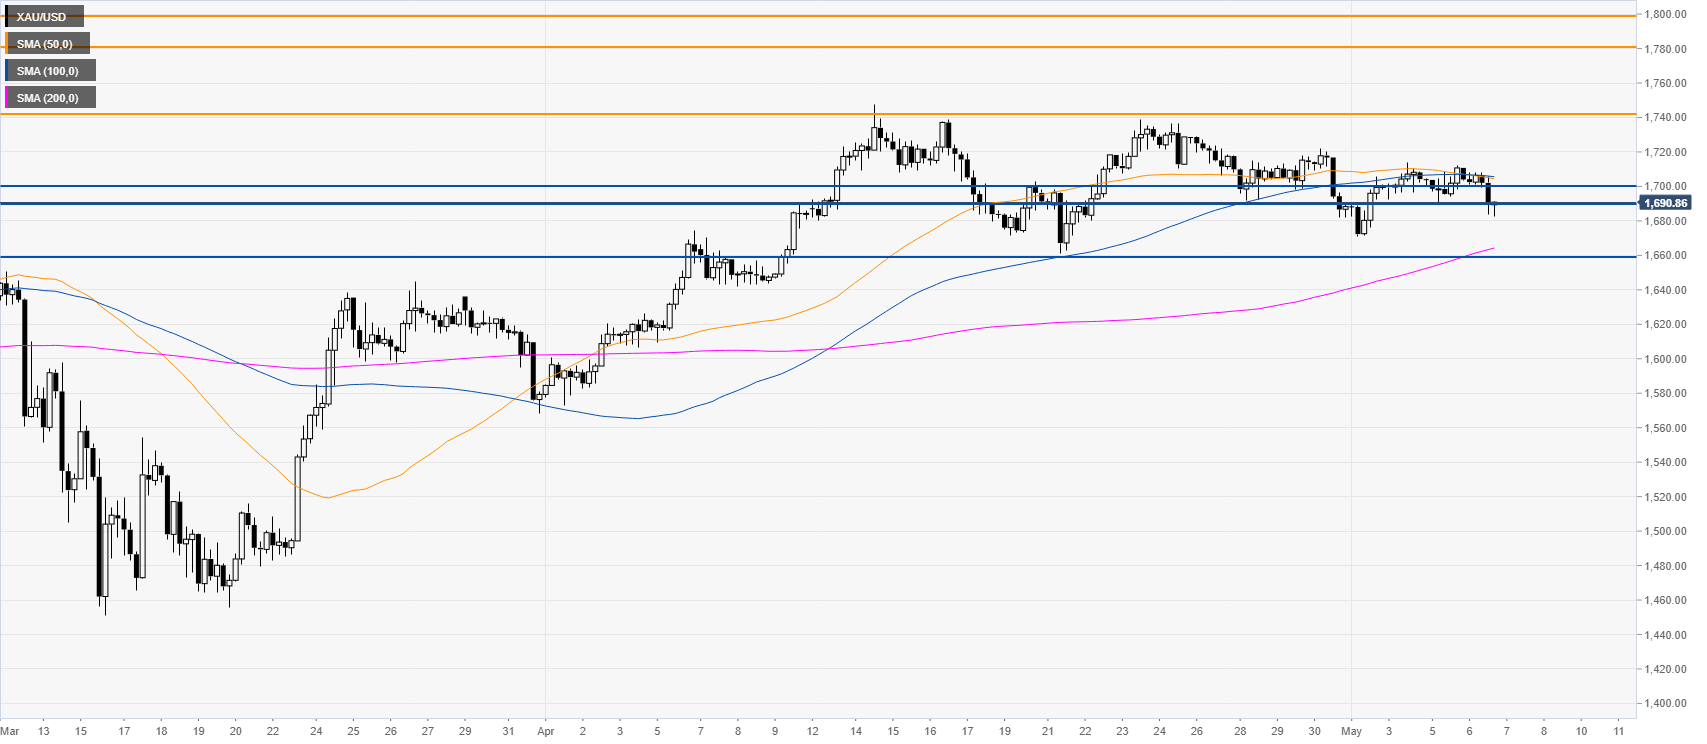
XAU/USD four-hour chart

 
XAU/USD is consolidating the bull-run from mid-March as gold trades in the 1690/1700 support zone but below the 50/100SMAs on the four-hour chart while above the 200 SMA. The bullish bias on XAU/USD remains intact with buyers eyeing for a break above the 1740 level on a daily closing basis which may open the gates toward the 1740 and 1780/1800 resistance zone. Conversely, support can emerge near 1660 price level in the medium-term.
  

Additional key levels

XAU/USD

Overview
Today last price1690.42
Today Daily Change-14.60
Today Daily Change %-0.86
Today daily open1705.02
 
Trends
Daily SMA201701.04
Daily SMA501640.39
Daily SMA1001597.49
Daily SMA2001543.87
 
Levels
Previous Daily High1712.27
Previous Daily Low1690.12
Previous Weekly High1728.71
Previous Weekly Low1670.72
Previous Monthly High1747.82
Previous Monthly Low1568.46
Daily Fibonacci 38.2%1703.81
Daily Fibonacci 61.8%1698.58
Daily Pivot Point S11692.67
Daily Pivot Point S21680.32
Daily Pivot Point S31670.52
Daily Pivot Point R11714.82
Daily Pivot Point R21724.62
Daily Pivot Point R31736.97

Author

Flavio Tosti

Flavio Tosti

Independent Analyst


More from Flavio Tosti
Share:

Markets move fast. We move first.

Orange Juice Newsletter brings you expert driven insights - not headlines. Every day on your inbox.

By subscribing you agree to our Terms and conditions.

Editor's Picks

EUR/USD edges higher to mid-1.1600s; looks to US PCE Price Index for fresh impetus

The EUR/USD pair attracts some dip-buyers during the Asian session on Friday and recovers a part of the previous day's retracement slide from the 1.1680 region, or the highest level since October 17. Spot prices currently trade around mid-1.1600s and remain on track to register gains for the second straight week.

GBP/USD: Constructive view prevails above 1.3300 ahead of US PCE inflation data

The GBP/USD pair trades on a flat note near 1.3330 during the Asian trading hours on Friday. Traders prefer to wait on the sidelines ahead of the key US inflation report later on Friday. The US delayed Personal Consumption Expenditures Price Index report for September could offer some hints about the US interest rate path.

Gold flat lines above $4,200 mark; looks to US PCE Price Index for some meaningful impetus

Gold struggles to capitalize on the overnight bounce from the $4,175 area, or the vicinity of the weekly trough, and oscillates in a narrow trading range during the Asian session on Friday. Traders now seem reluctant and opt to move to the sidelines ahead of the September Personal Consumption Expenditures Price Index, or the Federal Reserve's preferred inflation gauge. 

Pi Network: Bearish streak nears critical support trendline

Pi Network edges lower on Friday for the third consecutive day, approaching a local support trendline. The on-chain data suggests an increase in supply pressure as Centralized Exchanges experience a surge in inflows. Technically, the pullback in PI risks further losses, as the Moving Average Convergence Divergence indicator is flashing a sell signal. 

Why the Fed may cut rates in December: Understanding the policy shift

The Fed has gone through a noticeable policy swing in recent months - from initiating a rate cut, to signaling a potential pause, and now shifting once again toward another cut in December. This has created understandable confusion among traders and investors trying to interpret the Fed’s reaction function.

XRP edges lower despite record on-chain activity and steady ETF inflows

Ripple is trading under pressure at the time of writing on Thursday, after bulls failed to break the short-term resistance at $2.22. The reversal may extend toward Monday’s low of $1.98, especially if risk-off sentiment persists in the broader cryptocurrency market.