GDXJ – Gold miners junior: Impulse rally in motion

The VanEck Junior Gold Miners ETF (GDXJ) is an exchange-traded fund that provides exposure to small- and mid-cap companies primarily engaged in gold and silver mining worldwide. In this article, we will explore the long term Elliott Wave technical path of the ETF.
GDXJ monthly Elliott Wave view
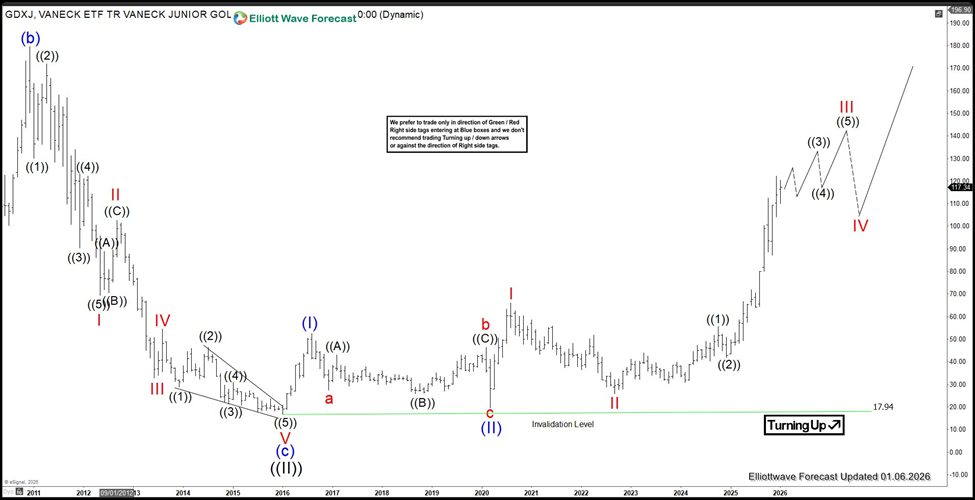
On the monthly timeframe, the Elliott Wave outlook for the Junior Gold Miners ETF ($GDXJ) highlights a significant structural development. The grand super cycle wave ((II)) found completion at $17.94, establishing a pivotal low. From that foundation, the ETF began a sustained advance, unfolding in the form of a nested impulse sequence. The initial rally carried wave (I) to $52.50 before a corrective decline in wave (II) retraced to $19.52. Strength then returned, propelling the instrument into wave (III).
Within this larger advance, the internal structure has also revealed clear subdivisions. From the wave (II) base, wave I extended to $65.95, followed by a corrective phase in wave II that concluded at $25.80. The broader trend remains constructive, provided the $17.94 low continues to hold as firm support. With that level intact, the ETF retains the potential to sustain its upward trajectory, consistent with the ongoing impulse pattern.
GDXJ daily Elliott Wave view
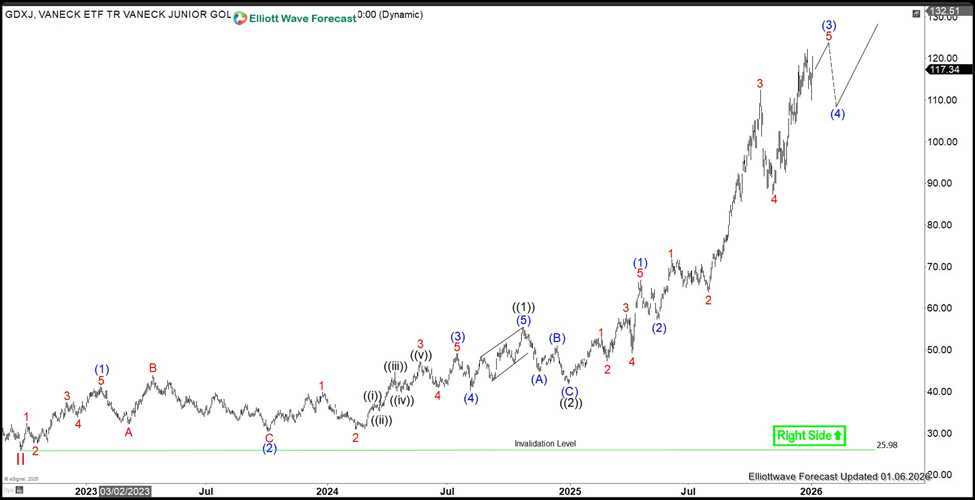
According to the daily Elliott Wave analysis of the VanEck Junior Gold Miners ETF (GDXJ), the major corrective wave II bottomed out at approximately $26. Within this framework, the ongoing wave III is developing as a clear impulsive advance with nested subdivisions. Starting from the wave II low, the initial subdivision ((1)) topped around $55.60. A corrective wave ((2)) then retraced to near $42. The rally then continued strongly into ((3)), which itself shows impulsive characteristics. Within ((3)), subwave (1) climaxed near $67, followed by a (2) correction down to about $57.50.
Subwave (3) of ((3)) appears close to completion at current levels, setting the stage for a wave (4) retracement shortly, after which the advance should resume in wave (5). On a shorter-term basis, provided the key pivot around $26 remains unbroken, any near-term dips are likely to find buyers in a 3-, 7-, or 11-swing sequence, allowing the broader uptrend to persist and push prices further upward.
Author

Elliott Wave Forecast Team
ElliottWave-Forecast.com


