|

GDX lower low sequence supports more downside [Video]

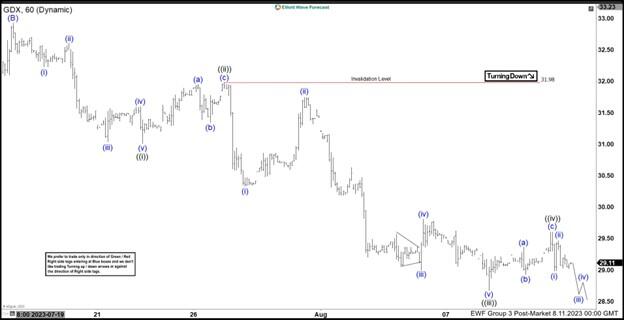
The short-term Elliott wave view in GDX suggests that the cycle from the 5 May 2023 peak is showing a 5 swings lower low sequence in higher time frame charts. Supporting more downside in the instrument. The decline from that peak is unfolding as an Elliott wave zigzag correction where wave (A) ended at $30.11 low. Wave (B) bounce unfolded as a lesser degree flat correction where wave A ended at $32.30 high. Wave B ended at $28.76 low, and wave C ended at $32.92 high thus completing wave (B).

Down from wave (B) high the decline is unfolding as an impulse sequence favoring more weakness. Whereas wave ((i)) ended at $31.01 low. Wave ((ii)) ended at $31.98 high, wave ((iii)) ended at $28.67 low, wave ((iv)) ended at $29.61 high. Below from there, wave ((v)) remains in progress with a minimum extension target coming at $28.45- $28.09 area lower before the next bounce happens. Near-term, as far as bounces fail below $31.98 & more importantly below $32.92 high the GDX is expected to extend lower to reach the extreme from May peak towards $26.77- $22.98 target area before a turn in favor of the ETF happens.

GDX 1 hour Elliott Wave chart from 8.11.2023

GDX Elliott Wave video

Author

Elliott Wave Forecast Team

Elliott Wave Forecast Team

ElliottWave-Forecast.com

More from Elliott Wave Forecast Team
Share:

Editor's Picks

EUR/USD trims gains, hovers around 1.1900 post-US data

EUR/USD trades slightly on the back foot around the 1.1900 region in a context dominated by the resurgence of some buying interest around the US Dollar on turnaround Tuesday. Looking at the US docket, Retail Sales disappointed expectations in December, while the ADP 4-Week Average came in at 6.5K.

GBP/USD comes under pressure near 1.3680

The better tone in the Greenback hurts the risk-linked complex on Tuesday, prompting GBP/USD to set aside two consecutive days of gains and trade slightly on the defensive below the 1.3700 mark. Investors, in the meantime, keep their attention on key UK data due later in the week.

Gold loses some traction, still above $5,000

Gold faces some selling pressure on Tuesday, surrendering part of its recent two-day advance although managing to keep the trade above the $5,000 mark per troy ounce. The daily pullback in the precious metal comes in response to the modest rebound in the US Dollar, while declining US Treasury yields across the curve seem to limit the downside.

XRP holds $1.40 amid ETF inflows and stable derivatives market

Ripple trades under pressure, with immediate support at $1.40 holding at the time of writing on Tuesday. A recovery attempt from last week’s sell-off to $1.12 stalled at $1.54 on Friday, leading to limited price action between the current support and the resistance.

Dollar drops and stocks rally: The week of reckoning for US economic data

Following a sizeable move lower in US technology Stocks last week, we have witnessed a meaningful recovery unfold. The USD Index is in a concerning position; the monthly price continues to hold the south channel support.

Bitcoin Cash trades lower, risks dead-cat bounce amid bearish signals

Bitcoin Cash (BCH) trades in the red below $522 at the time of writing on Tuesday, after multiple rejections at key resistance. BCH’s derivatives and on-chain indicators point to growing bearish sentiment and raise the risk of a dead-cat bounce toward lower support levels.