GBP/USD turns cautious on UK PMI Manufacturing miss, with focus on US data
- Pound Sterling retreats from three-year highs on expectations of a decline in the manufacturing sector.
- The US Dollar remains vulnerable ahead of PMI, Jobless Claims, and fiscal concerns after the House of Representatives passed Trump’s proposed tax bill.
- GBP/USD pauses as investors turn cautious in response to recent economic events.

The British Pound Sterling (GBP) has been gaining steadily against the US Dollar (USD) since January, reflecting diverging economic conditions between the United Kingdom and the United States.
This upward trend in GBP/USD comes as the world’s largest economy, the United States (US), shows signs of strain with growth forecasts softening and market sentiment turning cautious.
Several key factors have contributed to the recent weakness in the US Dollar. Investor confidence has faltered amid speculation that the Federal Reserve (Fed) might hold interest rates steady for a prolonged period, continuing to place pressure on consumers in the face of rising prices.
In addition, credit rating agency Moody’s downgraded US sovereign debt last week, further undermining the US Dollar’s appeal. Fiscal uncertainty has also intensified with the introduction of the “One Big, Beautiful” tax bill, a move aimed at reducing taxes while increasing spending.
While positioned as a relief measure for working Americans, the bill is expected to significantly cut federal revenue. To compensate, the administration has proposed reducing funding for programs such as Medicare and food assistance, a move that has raised concerns over the social and economic implications of shifting the burden away from taxation and onto public welfare.
Despite the Pound’s strength, the UK economic picture remains complex. The recent rise above the key 1.300 level in GBP/USD was bolstered by stronger-than-expected Retail Sales and a continued increase in the Consumer Price Index (CPI). However, inflationary pressure and geopolitical uncertainty present challenges to future growth prospects.
Risks, including supply chain disruptions and global trade tensions, continue to weigh on the UK’s economic outlook, tempering optimism around the Pound’s recent gains.
GBP/USD daily digest: The British Pound retreats from three-year lows in response to PMI miss.
- Wednesday’s UK Services Purchasing Managers Index (PMI) preliminary data rose to 50.2 in May, beating analyst forecasts of 50 and increasing from April’s reading of 49. The data represents an increase in expectations that the UK services sector expanded in May, which translates to a resilient service sector.
- In contrast, the Preliminary Purchasing Managers Index (PMI) missed analyst forecasts, printing at 45.1, below both the previous 45.4 reading and the 46 consensus.
- Decreasing confidence in the manufacturing sector is often reflective of economic activity declining, weighing on the growth forecasts for the UK economy.
- For the US, Thursday’s economic agenda includes a large number of important data releases, including the Manufacturing and Services PMI preliminary results.
- The Fed and investors will be monitoring Initial Jobless Claims and Home Sales data for April to gauge the health of the labour market and the housing market, which are perceived as leading indicators that have a major impact on interest rate expectations and consumer confidence.
GBP/USD technical analysis: Potential Cup and Handle hints at bullish continuation above 1.341
GBP/USD is facing its second consecutive day of losses after rising to its highest level in three years. With the pair temporarily testing the key psychological resistance level of 1.346, a minor pullback has occurred, pushing price action into a narrow range as investors look for a fresh catalyst that will likely arise from the fundamental differences between the two economies.
Meanwhile, the bullish trend pertaining to the pair since January currently remains intact, with the 20-day and 50-day Simple Moving Averages (SMA) providing additional barriers of support at the respective levels of 1.332 and 1.315, above another key psychological support level of 1.300.
GBP/USD daily chart
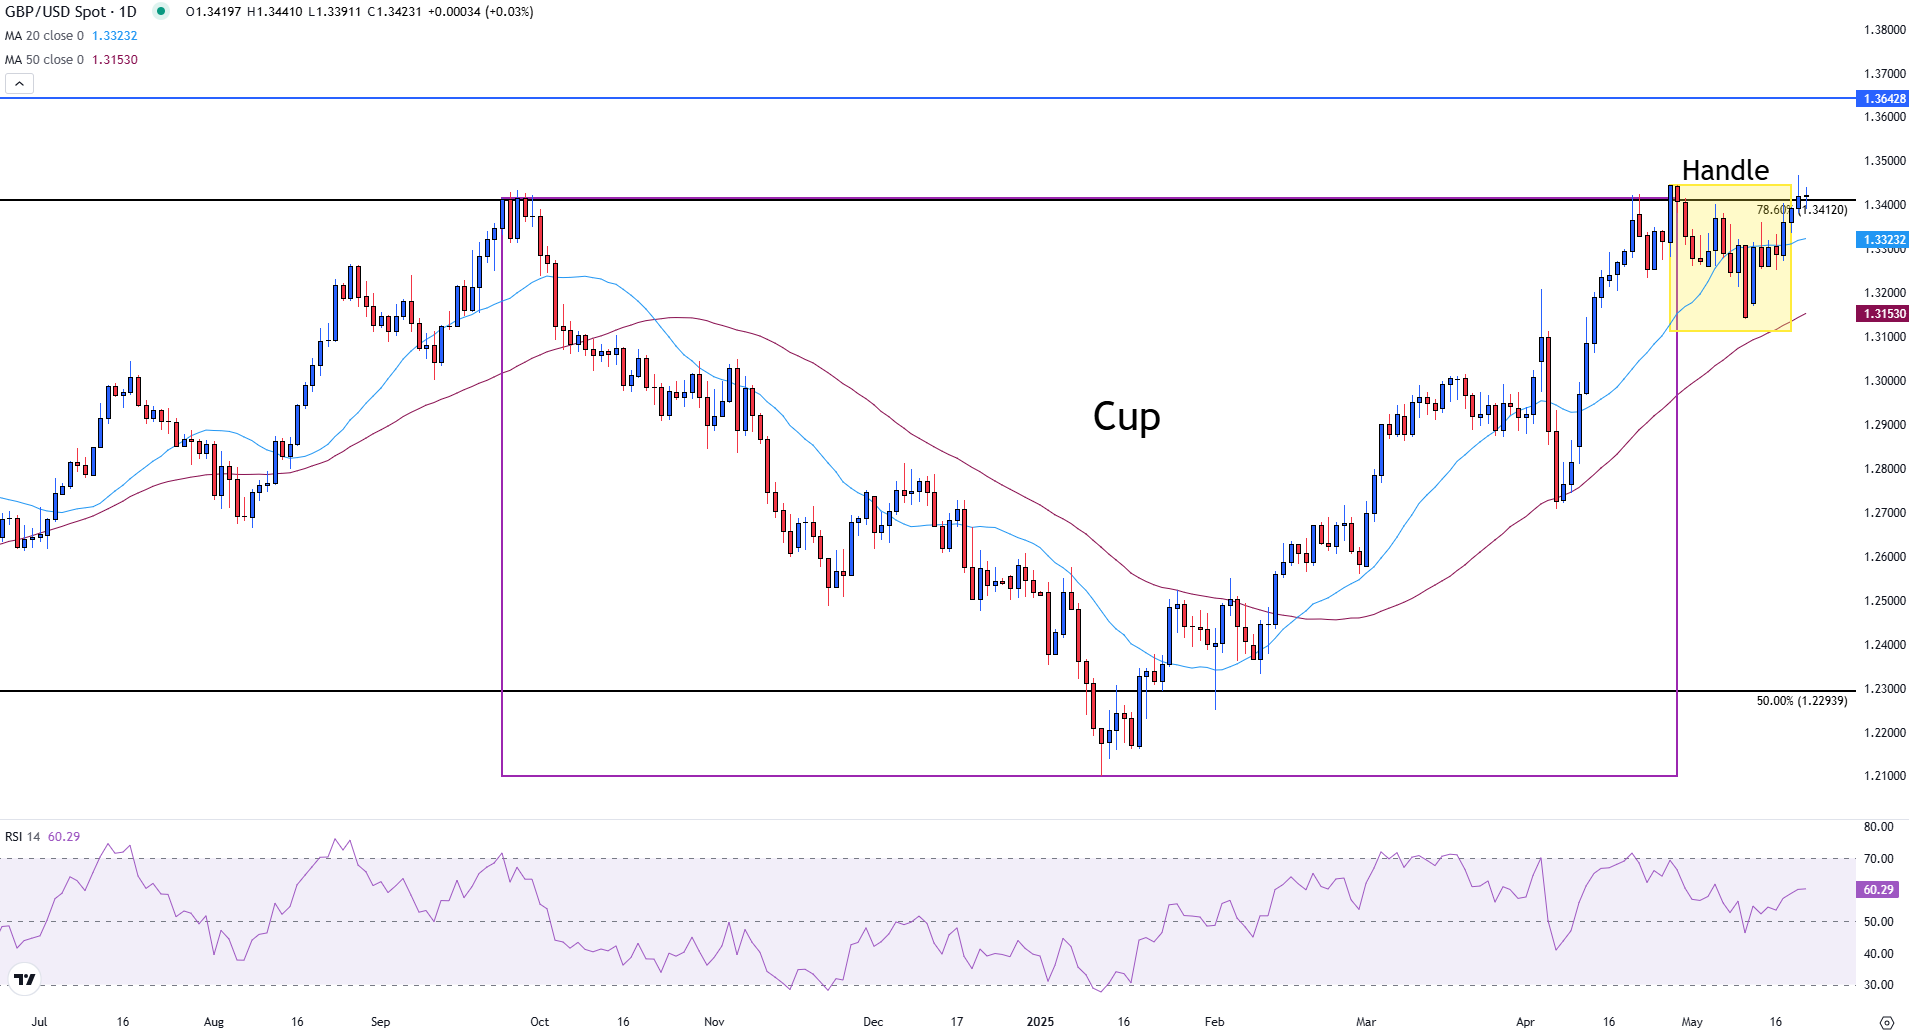
The 78.6% Fibonacci Retracement level of the May 2021 to September 2022 move has stepped in as resistance around 1.341, a level that capped the upside move in September and April.
With the bullish trend currently in play, a pause in upside momentum and a correction after a prolonged bull trend has resulted in a potential Cup and Handle pattern, a bullish continuation pattern that appears when prices retest a critical level of prior resistance before consolidating for a brief period of time. The pattern is confirmed when prices breach the prior barrier, resulting in a continuation of the prior trend.
The Relative Strength Index (RSI) is trading above the neutral 50 level at 60, representing that the short-term trend currently remains in favour of the bulls.
However, in order for the uptrend to persist, a clear break of the 1.341 level is required, which could open the door for the next psychological level of 1.350 and a potential retest of the February 2022 high at 1.364.
In contrast, a move below 1.341 may allow sellers to push prices back below the 20-day SMA and toward the 50-day SMA at 1.315.
(This article was corrected to reflect all numbers rounded to three decimals.)
GDP FAQs
A country’s Gross Domestic Product (GDP) measures the rate of growth of its economy over a given period of time, usually a quarter. The most reliable figures are those that compare GDP to the previous quarter e.g Q2 of 2023 vs Q1 of 2023, or to the same period in the previous year, e.g Q2 of 2023 vs Q2 of 2022. Annualized quarterly GDP figures extrapolate the growth rate of the quarter as if it were constant for the rest of the year. These can be misleading, however, if temporary shocks impact growth in one quarter but are unlikely to last all year – such as happened in the first quarter of 2020 at the outbreak of the covid pandemic, when growth plummeted.
A higher GDP result is generally positive for a nation’s currency as it reflects a growing economy, which is more likely to produce goods and services that can be exported, as well as attracting higher foreign investment. By the same token, when GDP falls it is usually negative for the currency. When an economy grows people tend to spend more, which leads to inflation. The country’s central bank then has to put up interest rates to combat the inflation with the side effect of attracting more capital inflows from global investors, thus helping the local currency appreciate.
When an economy grows and GDP is rising, people tend to spend more which leads to inflation. The country’s central bank then has to put up interest rates to combat the inflation. Higher interest rates are negative for Gold because they increase the opportunity-cost of holding Gold versus placing the money in a cash deposit account. Therefore, a higher GDP growth rate is usually a bearish factor for Gold price.
Author

Tammy Da Costa, CFTe®
FXStreet
Tammy is an economist and market analyst with a deep passion for financial markets, particularly commodities and geopolitics.


