GBP/USD trades thin on Wednesday as markets wait for a push


  • Pound Sterling stubbornly stuck to Wednesday’s opening range.
  • A smattering of UK data sparked some volatility, but little movement.
  • US Retail Sales and PPE figures in the barrel for Wednesday.

GBP/USD found some volatility on Wednesday, but overall directional momentum remains limited with the pair rangebound and pinned close to the day’s opening range near 1.2790. Technicals are struggling to push into either side of the 1.2800 handle in the midweek trading session, and investors are awaiting a spark in the data.

UK Industrial Production fell to -0.2% in January after December’s 0.6% print, missing the forecast flat print of 0.0%. UK MoM Manufacturing Production also declined, coming in at the expected 0.0% compared to the previous 0.8%. UK Gross Domestic Product (GDP) in January also met expectations, printing at 0.2% versus the previous -0.1%.

A thin showing for US data on Wednesday leaves investors waiting for Thursday’s Retail Sales and Producer Price Index (PPI) numbers. US Retail Sales are expected to rebound in February, with the median market forecast calling for a 0.8% print after January’s -0.8% decline. Meanwhile, February’s Core YoY PPI through February is expected to ease slightly, forecast to print at 1.9% compared to the previous 2.0%.

The trading week will wrap up with the University of Michigan’s Consumer Sentiment Index, which is broadly expected to hold steady at 76.9. Before that, mid-tier consumer inflation expectations from the UK will be seen early Friday during the London market session. At least read, UK consumers expected UK inflation to land somewhere around 3.3% for the following 12 months.

GBP/USD technical outlook

GBP/USD is cycling into the midweek, churning into the midrange as the pair grapples with an inflection point priced in just above 1.2750. Hourly candles have dropped a potential break of character just below the 1.2900 handle, and near-term action is set to consolidate until the stronger pattern emerges.

Daily candles are draining back into a heavy supply zone after a six-day bull run promptly ended this week, with the pair failing to capture to 1.2900. Consolidation plagues GBP/USD in the medium-term, and a bullish bounce from the 200-day Simple Moving Average (SMA) at 1.2590 is seeing limited topside momentum.

GBP/USD chart, hourly

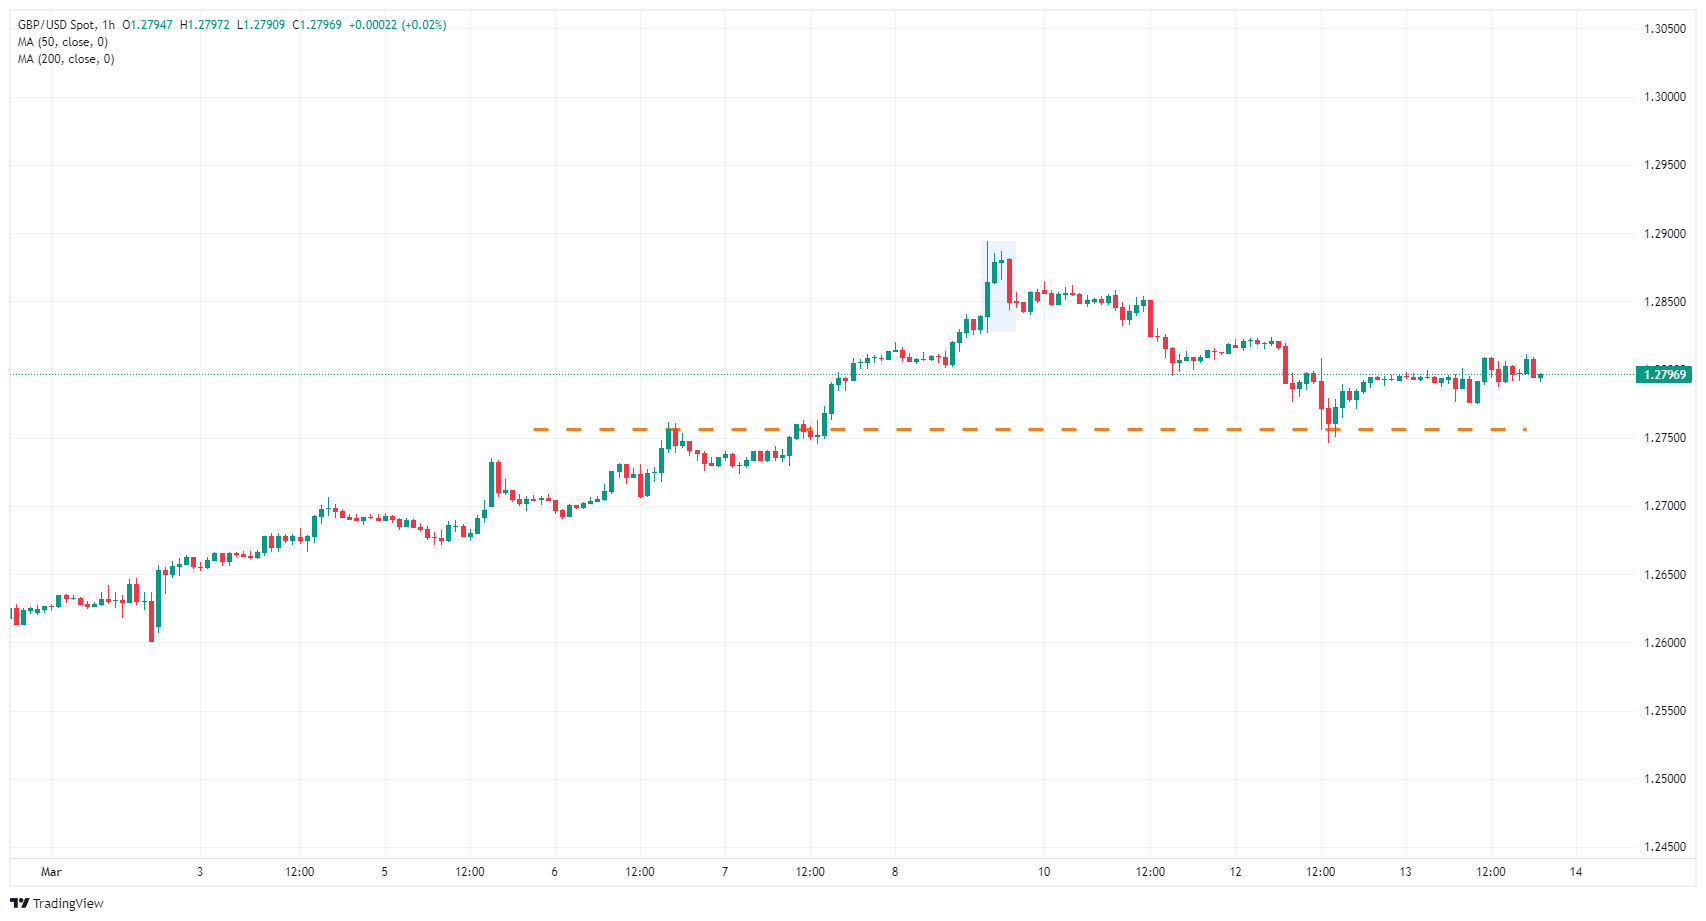
GBP/USD chart, daily
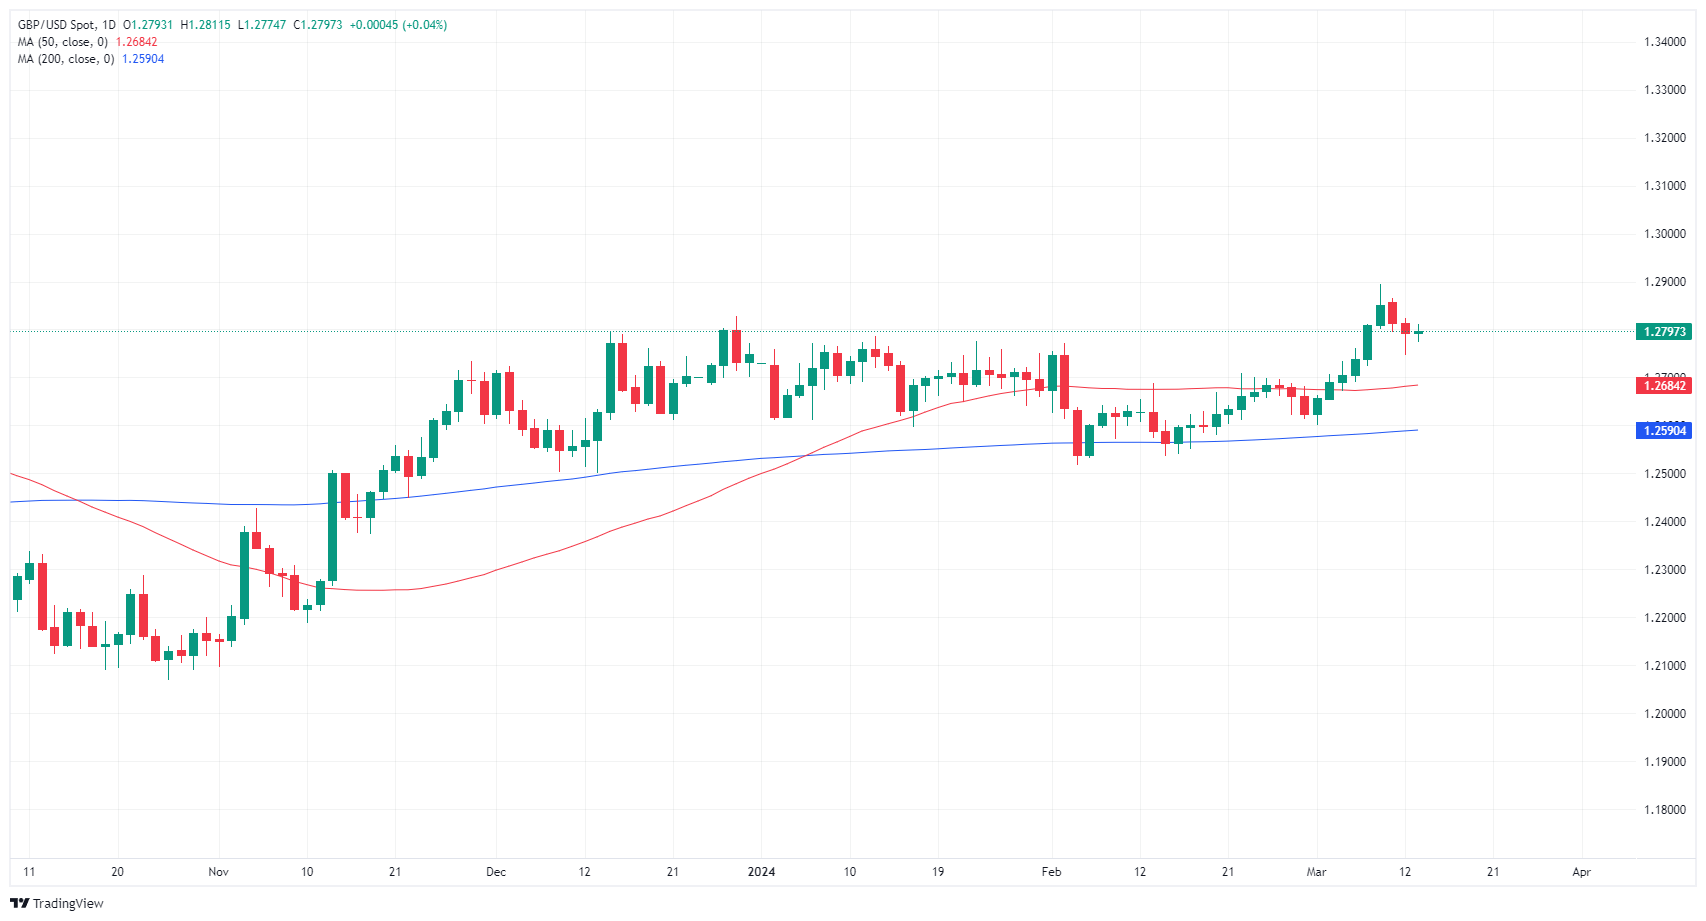
GBP/USD

Overview
Today last price 1.2796
Today Daily Change 0.0003
Today Daily Change % 0.02
Today daily open 1.2793
 
Trends
Daily SMA20 1.2683
Daily SMA50 1.2682
Daily SMA100 1.2595
Daily SMA200 1.2589
 
Levels
Previous Daily High 1.2824
Previous Daily Low 1.2746
Previous Weekly High 1.2894
Previous Weekly Low 1.2652
Previous Monthly High 1.2773
Previous Monthly Low 1.2518
Daily Fibonacci 38.2% 1.2776
Daily Fibonacci 61.8% 1.2794
Daily Pivot Point S1 1.2751
Daily Pivot Point S2 1.271
Daily Pivot Point S3 1.2674
Daily Pivot Point R1 1.2829
Daily Pivot Point R2 1.2865
Daily Pivot Point R3 1.2906


Share: Feed news

Information on these pages contains forward-looking statements that involve risks and uncertainties. Markets and instruments profiled on this page are for informational purposes only and should not in any way come across as a recommendation to buy or sell in these assets. You should do your own thorough research before making any investment decisions. FXStreet does not in any way guarantee that this information is free from mistakes, errors, or material misstatements. It also does not guarantee that this information is of a timely nature. Investing in Open Markets involves a great deal of risk, including the loss of all or a portion of your investment, as well as emotional distress. All risks, losses and costs associated with investing, including total loss of principal, are your responsibility. The views and opinions expressed in this article are those of the authors and do not necessarily reflect the official policy or position of FXStreet nor its advertisers. The author will not be held responsible for information that is found at the end of links posted on this page.

If not otherwise explicitly mentioned in the body of the article, at the time of writing, the author has no position in any stock mentioned in this article and no business relationship with any company mentioned. The author has not received compensation for writing this article, other than from FXStreet.

FXStreet and the author do not provide personalized recommendations. The author makes no representations as to the accuracy, completeness, or suitability of this information. FXStreet and the author will not be liable for any errors, omissions or any losses, injuries or damages arising from this information and its display or use. Errors and omissions excepted.

The author and FXStreet are not registered investment advisors and nothing in this article is intended to be investment advice.

Recommended content


Recommended content

Editors’ Picks

EUR/USD tumbles toward 1.1450 as MIddle East tensions linger

EUR/USD tumbles toward 1.1450 as MIddle East tensions linger

EUR/USD has come under renewed selling pressure, testing 1.1450 in the European session on Monday. The renewed US Dollar buying, amid deepening Middle East conflict, and mixed PMI data releases from Germany and the Eurozone weigh on the pair as the focus shifts to US data and central bank talks.

Could Iran block the Strait of Hormuz? Why Oil is on edge after US strikes

Could Iran block the Strait of Hormuz? Why Oil is on edge after US strikes

As the Israel-Iran conflict reaches new heights, an old threat is coming back to haunt the markets: that of the closure of the Strait of Hormuz. This narrow arm of the sea in the Persian Gulf, wedged between Iran to the north and the United Arab Emirates and Oman to the south, is much more than a simple sea passage.

Gold price hangs near daily low amid modest USD strength; downside seems cushioned

Gold price hangs near daily low amid modest USD strength; downside seems cushioned

Gold price retains its negative bias through the first half of the European session on Monday and currently trades near the lower end of its daily range. The US attack on Iran’s nuclear facilities on Sunday raises the risk of a broader conflict in the Middle East and benefits the US Dollar's status as the global reserve currency.

Five fundamentals for the week: World anxiously awaits Iran's response

Five fundamentals for the week: World anxiously awaits Iran's response Premium

The Middle East remains in the spotlight after a turbulent weekend. Fed Chair Jerome Powell faces lawmakers and may shed more light on the central bank's thinking, and a key inflation figure is expected later to promise a strong end to the week.

GBP/USD holds recovery above 1.3400, with eyes on UK PMI, Middle East woes

GBP/USD holds recovery above 1.3400, with eyes on UK PMI, Middle East woes

GBP/USD is holding its rebound above 1.3400 in the European session on Monday. The fears that Iran would retaliate against US attacks on its nuclear sites continue to support the safe-haven US Dollar. Investors await the June preliminary PMI readings from the UK and the US for fresh trading directives. 

The Best brokers to trade EUR/USD

The Best brokers to trade EUR/USD

SPONSORED Discover the top brokers for trading EUR/USD in 2025. Our list features brokers with competitive spreads, fast execution, and powerful platforms. Whether you're a beginner or an expert, find the right partner to navigate the dynamic Forex market.

Forex MAJORS

Cryptocurrencies

Signatures

Best Brokers of 2025