GBP/USD tests below 1.24 as Pound Sterling softens
- The GBP/USD is testing three-month lows after closing flat or bearish for seven of the last eight weeks.
- UK data continues to disappoint, suggesting a floundering economic outlook.
- US data keeps beating expectations, boosting USD in major trading pairs.

The Pound Sterling (GBP) is notably bearish for Thursday, briefly breaking beneath the 1.2400 major handle against the Greenback (USD) as bears keep the GBP pinned to the floor.
Risk appetite continues to waffle for the Pound Sterling after Wednesday’s disappointing showing on the United Kingdom’s (UK) economic calendar docket. Gross Domestic Product (GDP) figures for the UK slipped more than markets expected, with the July figure decreasing by 0.5%, worse than the expected 0.2% decline and wiping out the previous month’s 0.5% gain.
Sterling bulls held back by soft economic data for the UK
Industrial Production for the same month also missed forecasts, with July’s figure printing a worse-than-expected -0.7% (forecast -0.6%), taking a big chunk out of the previous month’s 1.8% increase.
US Consumer Price Index (CPI) figures on Wednesday provided plenty of support for the USD, with inflation figures for the month of August coming in as expected at 0.6%, an acceleration from the previous month’s 0.2%.
On Thursday, the US saw Initial Jobless Claims, Producer Price Index (PPI), and Retail Sales figures.
Initial Jobless Claims for the week into September 8th came in better than expected, printing at 220K new claimants versus the forecast 225K. The previous week came in at 217K.
The PPI for August came in above forecast, clocking in at 0.7% versus the expected 0.4%, which was in-line with the previous figure. Retail Sales also improved, ticking up to 0.6% against the previous month’s 0.5% showing, and reversing the market forecast slowdown to 0.2%.
Friday will see the economic calendar firmly in the hands of Greenback bulls, with the Michigan Consumer Sentiment Index slated to show a minor decline from 69.1 to 69.5. If the indicator prints at or above expectations, it could give the USD just the bump it needs to extend gains into the weekly close.
GBP/USD technical outlook
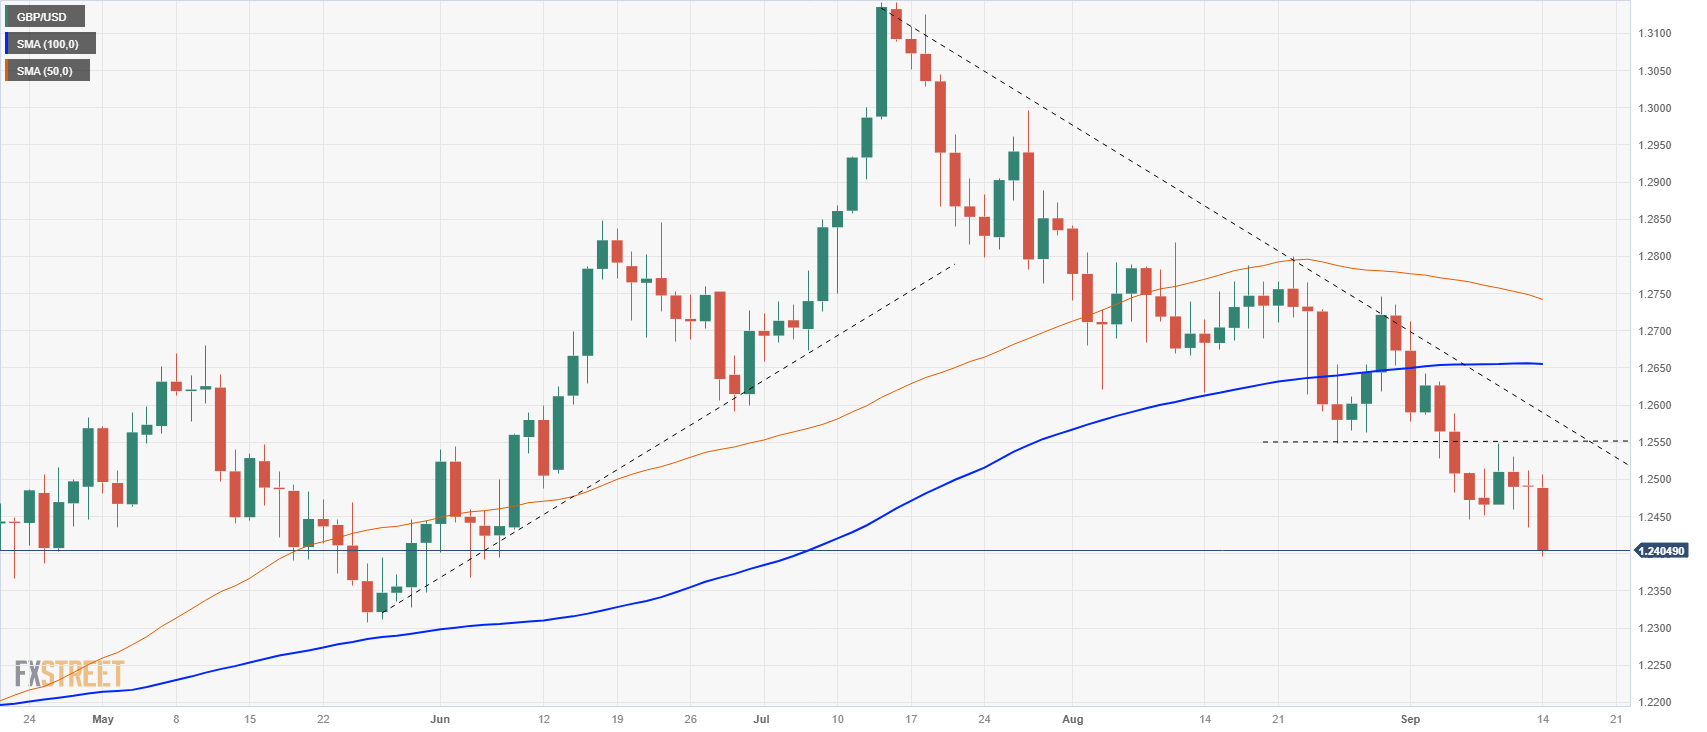
The Pound Sterling has chalked in a new daily low below the 1.2400 handle in Thursday trading. Recent declines have taken the pair well below the 100-day Simple Moving Average (SMA) currently sitting at 1.2650, and the 50-day SMA has turned bearish from 1.2750.
A continued slide in the GBP/USD pair will see late May’s swing lows near 1.2300 challenged, while a relief rally for bidders will see the last swing low near 1.2550 acting as near-term resistance.
GBP/USD daily chart
GBP/USD technical levels
Author

Joshua Gibson
FXStreet
Joshua joins the FXStreet team as an Economics and Finance double major from Vancouver Island University with twelve years' experience as an independent trader focusing on technical analysis.
















