|

GBP/USD technical analysis: Small intraday bounce drives Cable near 1.2141 resistance

  • GBP/USD is consolidating last week gains as the market trades near the 1.2141 resistance.
  • The levels to beat for bears are the 1.2122 and 1.2097 levels.
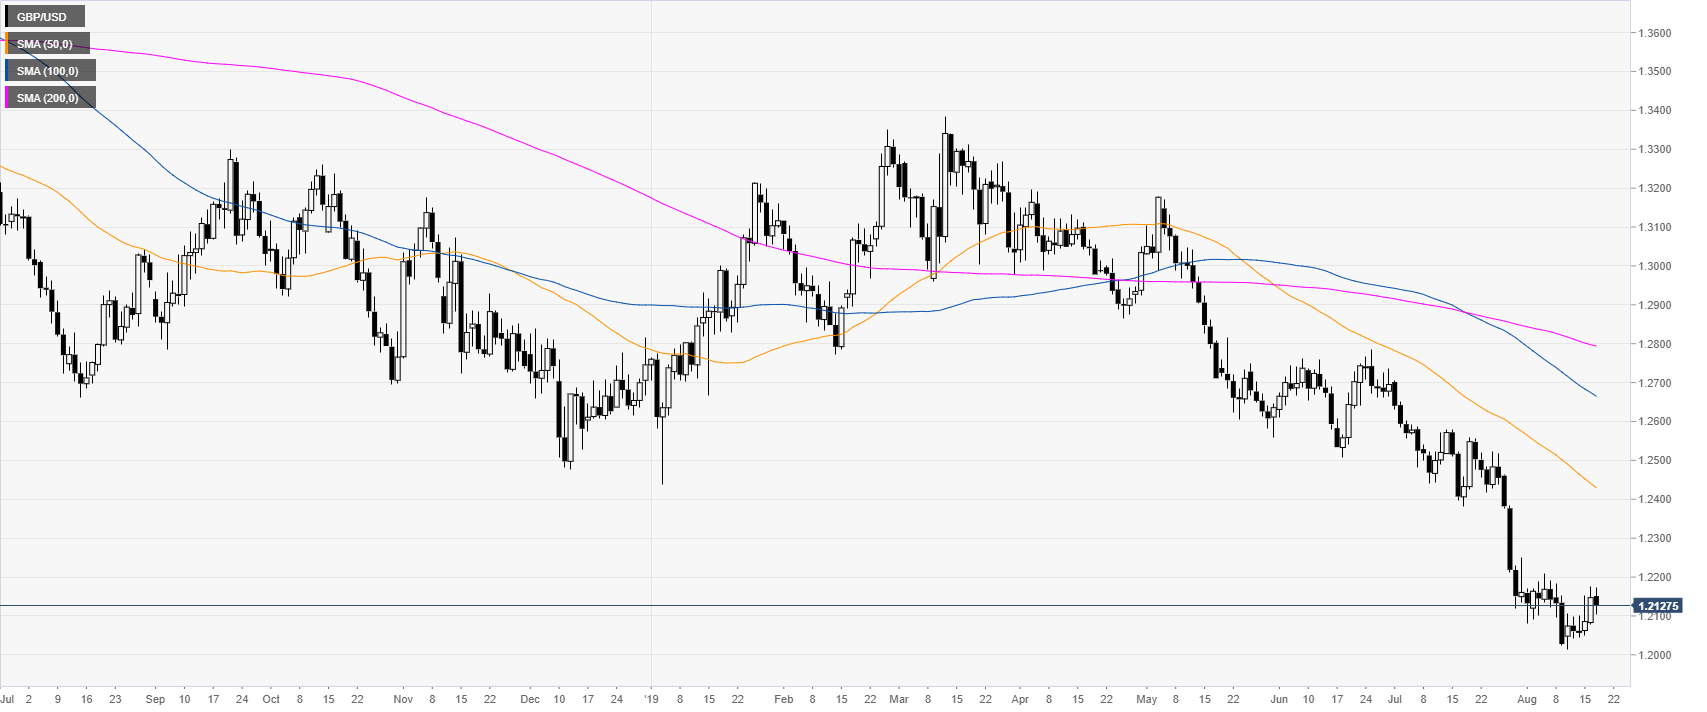
GBP/USD daily chart

 
The Cable is trading in a bear trend below its main daily simple moving averages (SMAs). The market is consolidating last week's modest advance.
 
GBPUSDDaily

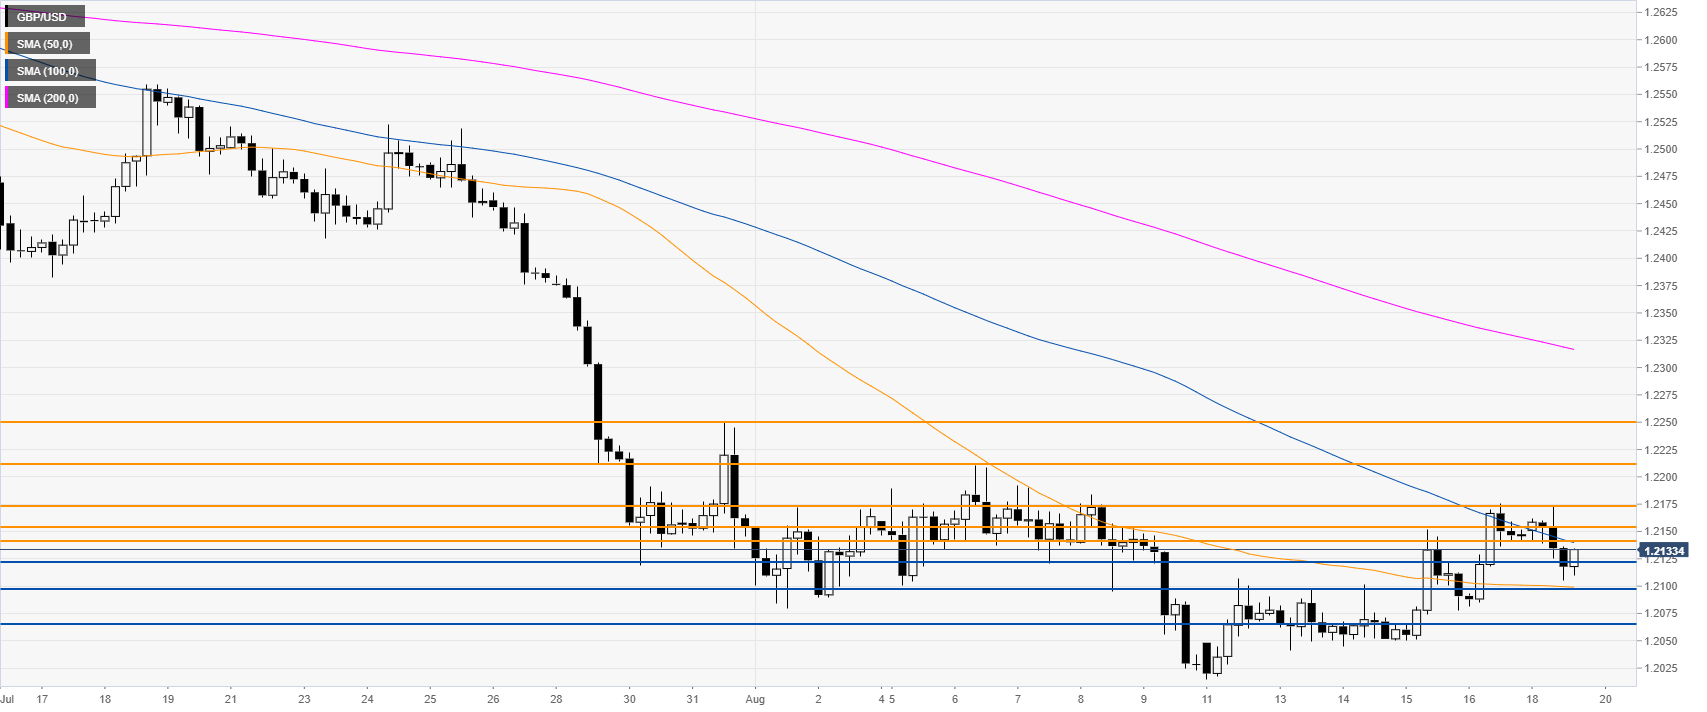
GBP/USD 4-hour chart

 
GBP/USD is trading below 1.2141 resistance and the 100/200 SMAs suggesting a bearish bias in the medium term. The levels to beat for bears are 1.2122, followed by 1.2097 and 1.2065, according to the Technical Confluences Indicator.
 
GBPUSD4h
 

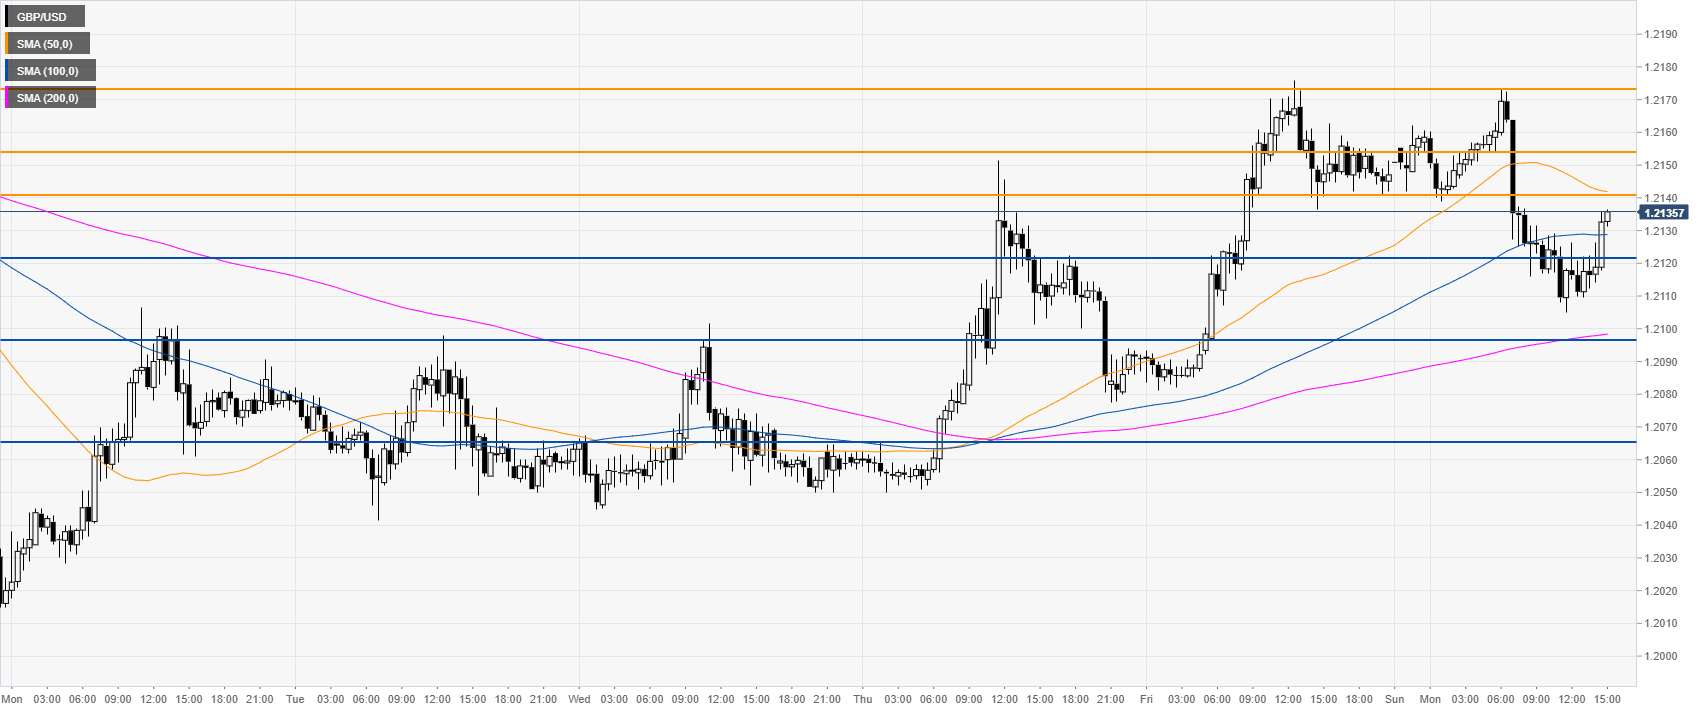
GBP/USD 30-minute chart

 
GBP/USD is losing steam on Monday. Immediate resistances are seen at 1.2141, 1.2154 and the 1.2173 level, according to the Technical Confluences Indicator.
 
GBPUSD30min


Additional key levels

GBP/USD

Overview
Today last price1.2133
Today Daily Change-0.0014
Today Daily Change %-0.12
Today daily open1.2147
 
Trends
Daily SMA201.2205
Daily SMA501.2441
Daily SMA1001.2675
Daily SMA2001.2797
Levels
Previous Daily High1.2176
Previous Daily Low1.2077
Previous Weekly High1.2176
Previous Weekly Low1.2015
Previous Monthly High1.2706
Previous Monthly Low1.2119
Daily Fibonacci 38.2%1.2138
Daily Fibonacci 61.8%1.2115
Daily Pivot Point S11.2091
Daily Pivot Point S21.2035
Daily Pivot Point S31.1992
Daily Pivot Point R11.219
Daily Pivot Point R21.2232
Daily Pivot Point R31.2288

Author

Flavio Tosti

Flavio Tosti

Independent Analyst


More from Flavio Tosti
Share:

Editor's Picks

EUR/USD looks apathetic around 1.1770

EUR/USD comes under renewed pressure on Tuesday, deflating below the 1.1800 support and reversing two consecutive days of gains. The pair’s decline follows the persistent move higher in the US Dollar, as trade uncertainty dominates the sentiment ahead of President Trump’s SOTU speech.

GBP/USD regains 1.3500 and above

GBP/USD extends its advance for the third day in a row on Tuesday, this time retesting the area beyond the 1.3500 hurdle. Cable’s uptick comes despite decent gains in the Greenback and the dovish message from the BoE’s Bailey at the UK Parliament.

Gold appears offered around $5,150

Gold is giving back a good portion of the recent multi-day rally, receding to the $5,150 zone per troy ounce amid the decent bounce in the US Dollar and mixed US Treasuty yields. In the meantime, markets’ attention remain on upcoming comments from Fed speakers.

Ripple’s DeFi shift in focus: Navigating XRPL EVM sidechain growth, XRPFi migration and liquidity

Ripple (XRP) has continued to trade under pressure, extending its decline by approximately 63% from the record high of $3.66 in July. The remittance token is trading above support at $1.35, while its upside appears limited by key supply zones, starting with $1.40, at the time of writing on Tuesday.

The Citrini report: How a debatable AI narrative can shake Wall Street

That AI-related headline alone was enough to rattle investors.US stocks slid sharply on Monday after a widely circulated Citrini Research memo outlined a hypothetical “2028 Global Intelligence Crisis”, warning that rapid AI adoption could push US unemployment into double digits as early as by mid-2028.

XRP pressured by weak ETF flows and declining retail interest

Ripple (XRP) is edging lower, trading above its intraday low of $1.32 at the time of writing on Tuesday. The decline from its weekly opening of $1.39 reflects heightened volatility in the broader cryptocurrency market, accentuated by tariff-triggered uncertainty.