|

GBP/USD technical analysis: Slides below mid-1.2200s post-UK PMI, remains vulnerable

  • The overnight strong recovery once again faltered near the 1.2340-50 confluence zone.
  • Disappointing UK construction PMI does little to provide any respite to the British Pound.

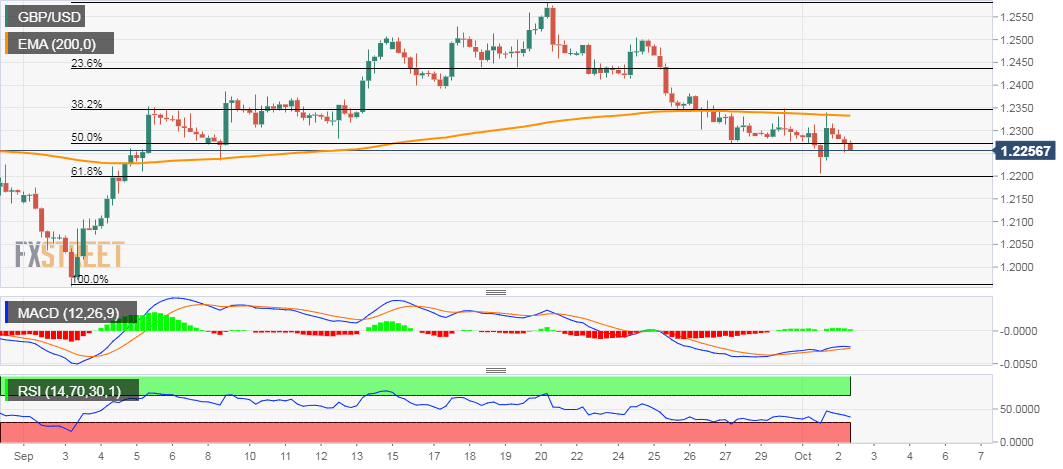
The GBP/USD pair on Tuesday staged a solid intraday bounce of over 125 pips from the 1.2200 neighbourhood - a support marked by 61.8% Fibonacci level of the 1.1958-1.2583 recent strong move up. The uptick, however, lacked any strong follow-through and once again faltered near the 1.2340-50 supply zone.
 
The mentioned barrier marks a confluence region - comprising of 200-hour EMA and 38.2% Fibonacci level - and should now act as a key pivotal point for short-term traders. The pair met with some fresh supply on Wednesday and remained depressed following the release of yet another disappointing UK construction PMI.
 
Meanwhile, technical indicators on hourly charts maintained their bearish bias and have just started drifting into the bearish territory on the daily chart. The set-up support prospects for a further depreciating move back towards the 1.2235-30 intermediate support en-route the 1.2200 round-figure mark.
 
Failure to defend the mentioned handle, leading to a subsequent break below the 1.2170-65 horizontal zone will set the stage for a slide back towards testing sub-1.2100 levels. On the flip side, the 1.2280-85 region now seems to act as immediate resistance and any further recovery beyond the 1.2300 handle seems more likely to remain capped near 1.2340-50 region.

GBP/USD 4-hourly chart

fxsoriginal

GBP/USD

Overview
Today last price1.2257
Today Daily Change-0.0048
Today Daily Change %-0.39
Today daily open1.2305
 
Trends
Daily SMA201.2381
Daily SMA501.2259
Daily SMA1001.2443
Daily SMA2001.2728
 
Levels
Previous Daily High1.234
Previous Daily Low1.2205
Previous Weekly High1.2504
Previous Weekly Low1.2271
Previous Monthly High1.2583
Previous Monthly Low1.1958
Daily Fibonacci 38.2%1.2288
Daily Fibonacci 61.8%1.2256
Daily Pivot Point S11.2227
Daily Pivot Point S21.2148
Daily Pivot Point S31.2092
Daily Pivot Point R11.2362
Daily Pivot Point R21.2418
Daily Pivot Point R31.2496

Author

Haresh Menghani

Haresh Menghani is a detail-oriented professional with 10+ years of extensive experience in analysing the global financial markets.

More from Haresh Menghani
Share:

Editor's Picks

EUR/USD treads water above 1.1850 amid thin trading

EUR/USD stays defensive but holds 1.1850 amid quiet markets in the European hours on Monday.  The US Dollar is struggling for direction due to thin liquidity conditions as US markets are closed in observance of Presidents' Day. 

GBP/USD flat lines as traders await key UK and US macro data

GBP/USD kicks off a new week on a subdued note and oscillates in a narrow range near 1.365 in Monday's European trading. The mixed fundamental backdrop warrants some caution for aggressive traders as the market focus now shifts to this week's important releases from the UK and the US.

Gold sticks to intraday losses; lacks follow-through

Gold remains depressed through the early European session on Monday, though it has managed to rebound from the daily trough and currently trades around the $5,000 psychological mark. Moreover, a combination of supporting factors warrants some caution for aggressive bearish traders, and before positioning for deeper losses.

Bitcoin, Ethereum and Ripple consolidate within key ranges as selling pressure eases

Bitcoin and Ethereum prices have been trading sideways within key ranges following the massive correction. Meanwhile, XRP recovers slightly, breaking above the key resistance zone. The top three cryptocurrencies hint at a potential short-term recovery, with momentum indicators showing fading bearish signs.

Global inflation watch: Signs of cooling services inflation

Realized inflation landed close to expectations in January, as negative base effects weighed on the annual rates. Remaining sticky inflation is largely explained by services, while tariff-driven goods inflation remains limited even in the US.

Monero Price Forecast: XMR risks a drop below $300 under mounting bearish pressure

Monero (XMR) starts the week under pressure, recording a 4% decline at press time on Monday after a 7% drop the previous day, putting the $300 support zone in focus.