GBP/USD technical analysis: Choppy inside descending triangle
- The GBP/USD pair pulls back from short-term triangle support.
- While a downside break can fetch the pair back to a multi-month low, formation resistance stands tall to question the recent advances.
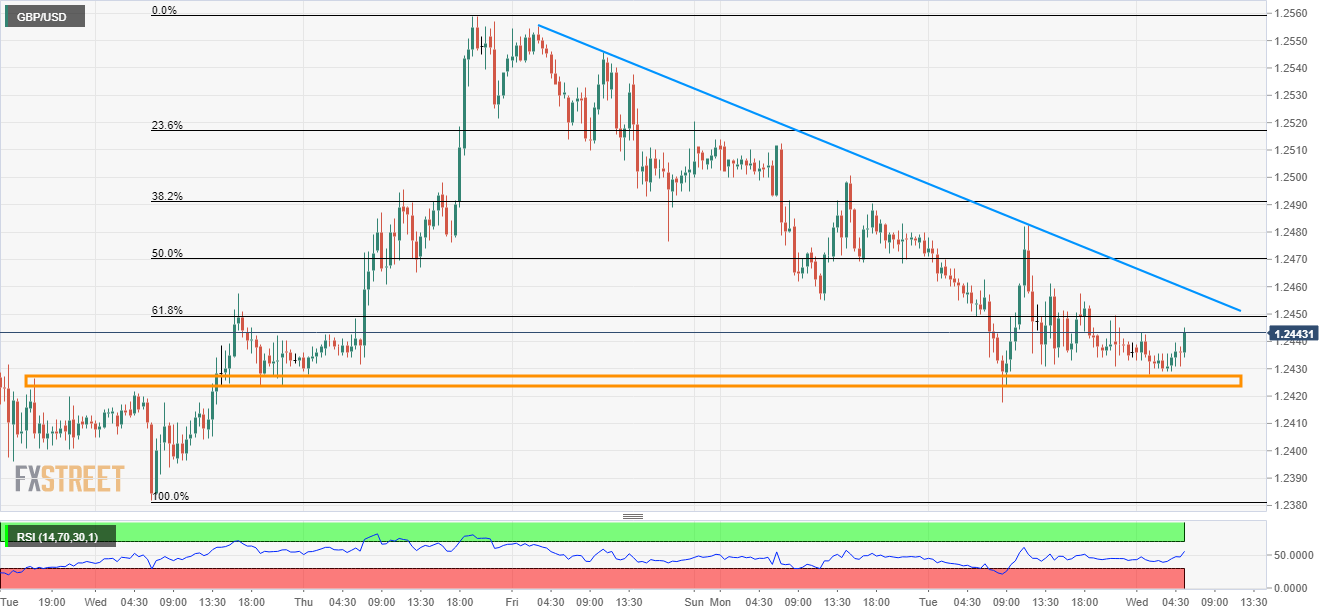
A week-old descending triangle formation triggers the GBP/USD pair’s bounce off the support as it takes the bids to 1.2440 ahead of the UK open on Wednesday.
While 1.2450 can entertain intra-day buyers, triangle resistance, at 1.2560, becomes a tough nut to crack for the bulls targeting 1.2500 round-figure.
Given the pair’s ability to rise past-1.2500, 1.2515 and 1.2560 could come back on the chart.
Alternatively, a downside break of 1.2428/24 support area can quickly fetch the quote to 1.2382 whereas 1.2365 and 1.2330 may please sellers afterward.
GBP/USD 30-minute chart
Trend: Pullback expected
Author

Anil Panchal
FXStreet
Anil Panchal has nearly 15 years of experience in tracking financial markets. With a keen interest in macroeconomics, Anil aptly tracks global news/updates and stays well-informed about the global financial moves and their implications.


