|

GBP/USD Technical Analysis: Cable under pressure below 1.3200 figure
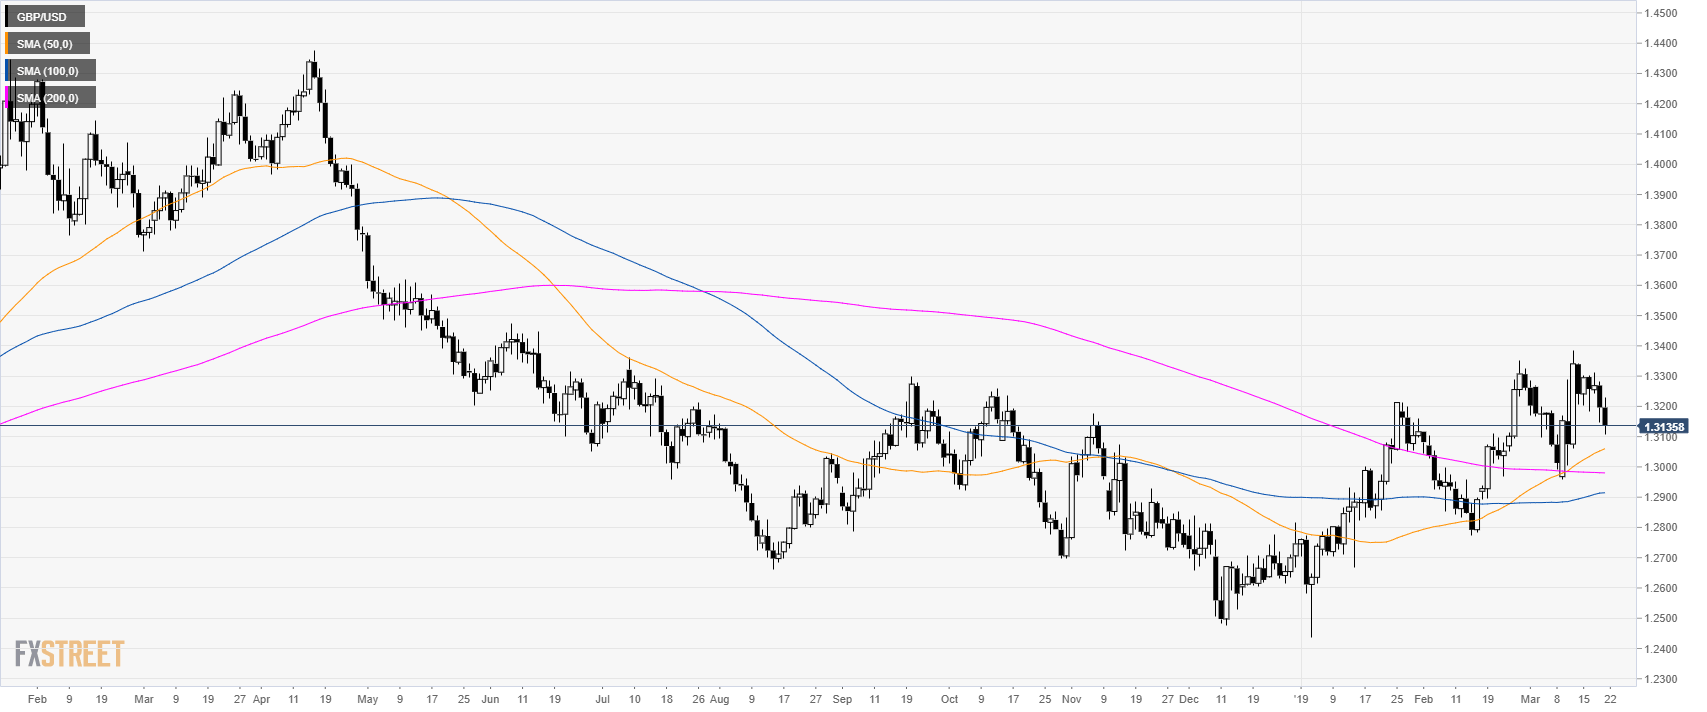
GBP/USD daily chart

  • GBP/USD is trading in a bull trend above its main simple moving averages (SMAs).


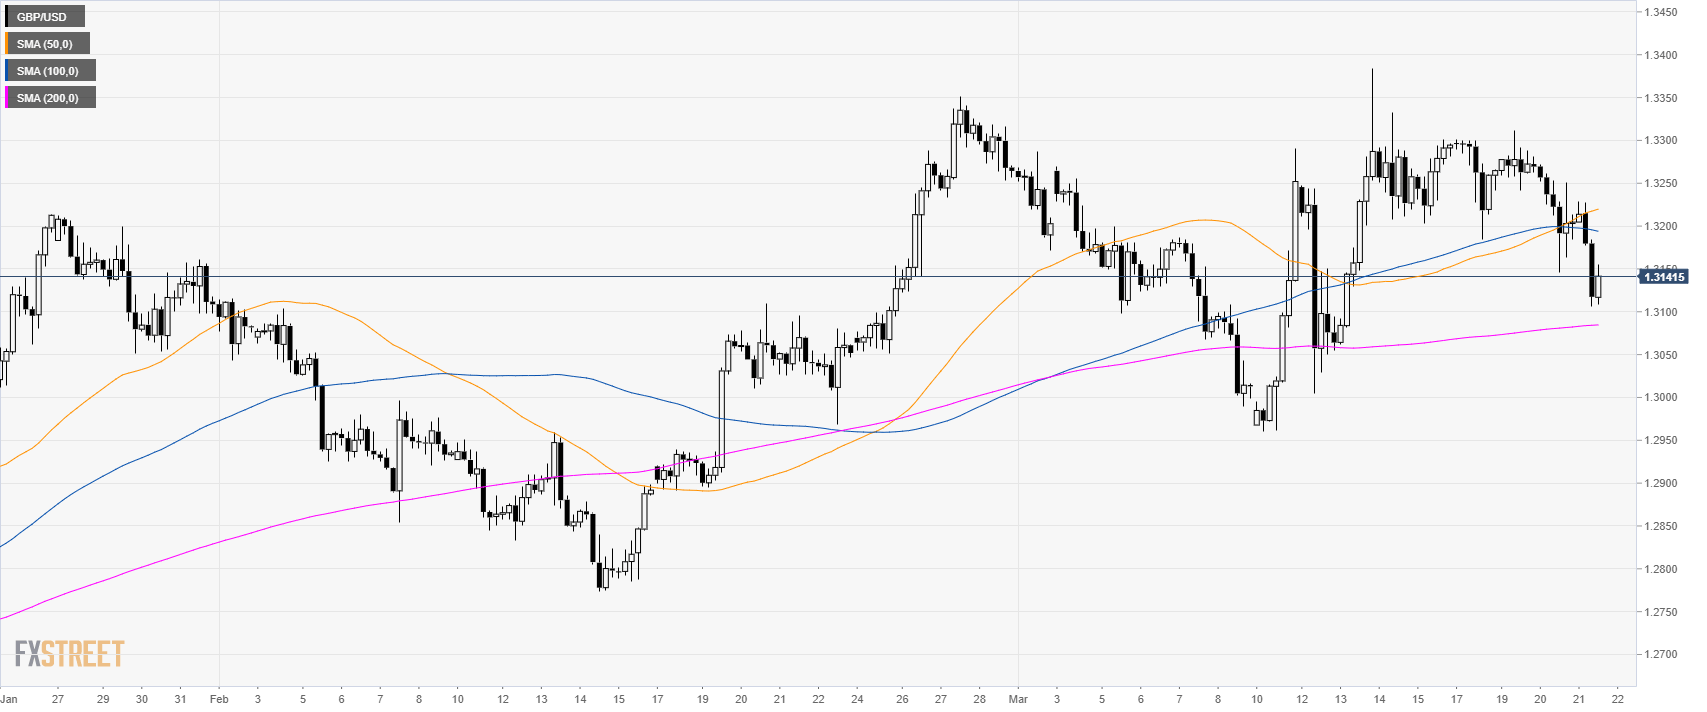
GBP/USD 4-hour chart

  • GBP/USD is trading between the 100 and 200 SMAs suggesting a consolidation in the medium-term.

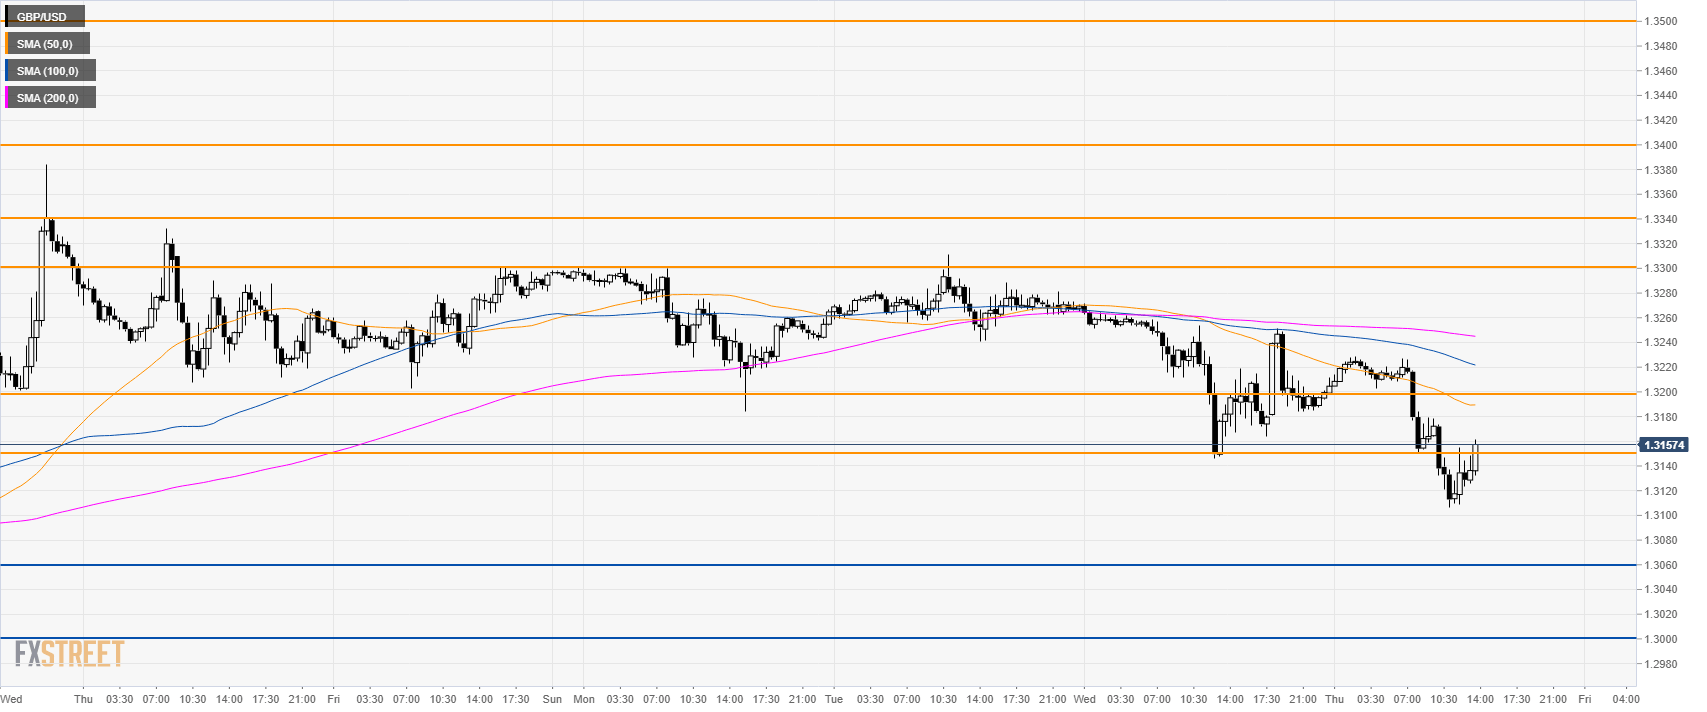
GBP/USD 30-minute chart

  • GBP/USD is trading below the 1.3200 figure and its main SMAs suggesting bearish momentum in the short-term.
  • Investors can expect short-term resistance at 1.3150 and 1.3200 figure.
  • To the downside, support is at 1.3060 figure and 1.300 figure.


Additional key levels

GBP/USD

Overview
Today last price1.3157
Today Daily Change-0.0039
Today Daily Change %-0.30
Today daily open1.3196
 
Trends
Daily SMA201.3183
Daily SMA501.3052
Daily SMA1001.2913
Daily SMA2001.298
 
Levels
Previous Daily High1.3282
Previous Daily Low1.3146
Previous Weekly High1.3384
Previous Weekly Low1.296
Previous Monthly High1.3351
Previous Monthly Low1.2773
Daily Fibonacci 38.2%1.3198
Daily Fibonacci 61.8%1.323
Daily Pivot Point S11.3134
Daily Pivot Point S21.3072
Daily Pivot Point S31.2999
Daily Pivot Point R11.327
Daily Pivot Point R21.3344
Daily Pivot Point R31.3405

Author

Flavio Tosti

Flavio Tosti

Independent Analyst


More from Flavio Tosti
Share:

Editor's Picks

EUR/USD trims gains, hovers around 1.1900 post-US data

EUR/USD trades slightly on the back foot around the 1.1900 region in a context dominated by the resurgence of some buying interest around the US Dollar on turnaround Tuesday. Looking at the US docket, Retail Sales disappointed expectations in December, while the ADP 4-Week Average came in at 6.5K.

GBP/USD comes under pressure near 1.3680

The better tone in the Greenback hurts the risk-linked complex on Tuesday, prompting GBP/USD to set aside two consecutive days of gains and trade slightly on the defensive below the 1.3700 mark. Investors, in the meantime, keep their attention on key UK data due later in the week.

Gold loses some traction, still above $5,000

Gold faces some selling pressure on Tuesday, surrendering part of its recent two-day advance although managing to keep the trade above the $5,000 mark per troy ounce. The daily pullback in the precious metal comes in response to the modest rebound in the US Dollar, while declining US Treasury yields across the curve seem to limit the downside.

XRP holds $1.40 amid ETF inflows and stable derivatives market

Ripple trades under pressure, with immediate support at $1.40 holding at the time of writing on Tuesday. A recovery attempt from last week’s sell-off to $1.12 stalled at $1.54 on Friday, leading to limited price action between the current support and the resistance.

Dollar drops and stocks rally:  The week of reckoning for US economic data

Following a sizeable move lower in US technology Stocks last week, we have witnessed a meaningful recovery unfold. The USD Index is in a concerning position; the monthly price continues to hold the south channel support.

XRP holds $1.40 amid ETF inflows and stable derivatives market

Ripple trades under pressure, with immediate support at $1.40 holding at the time of writing on Tuesday. A recovery attempt from last week’s sell-off to $1.12 stalled at $1.54 on Friday, leading to limited price action between the current support and the resistance.