|

GBP/USD Technical Analysis: Cable trading below 1.3300 resistance
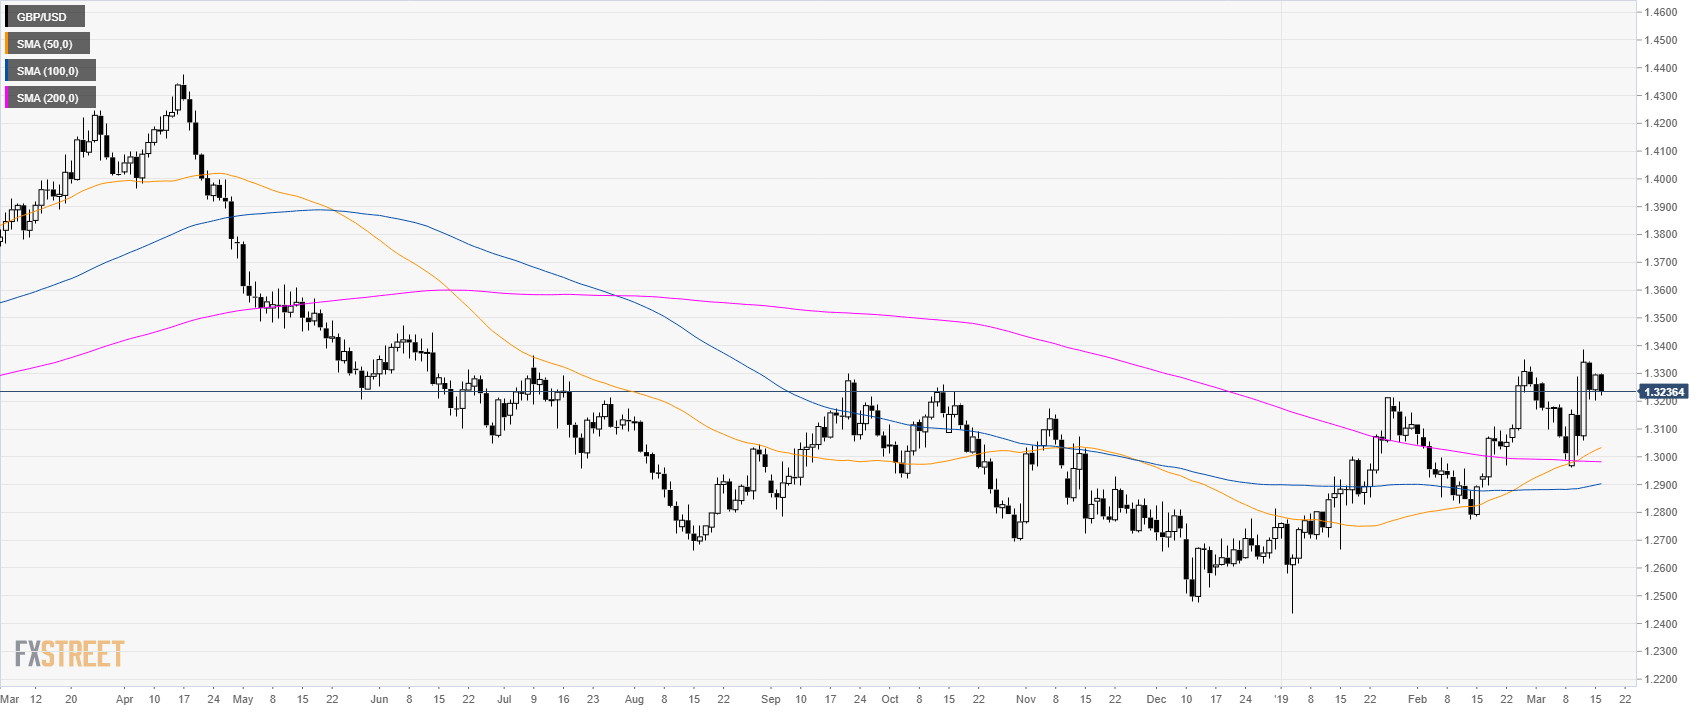
GBP/USD daily chart

  • GBP/USD is trading in a bull trend above its main simple moving averages (SMAs).


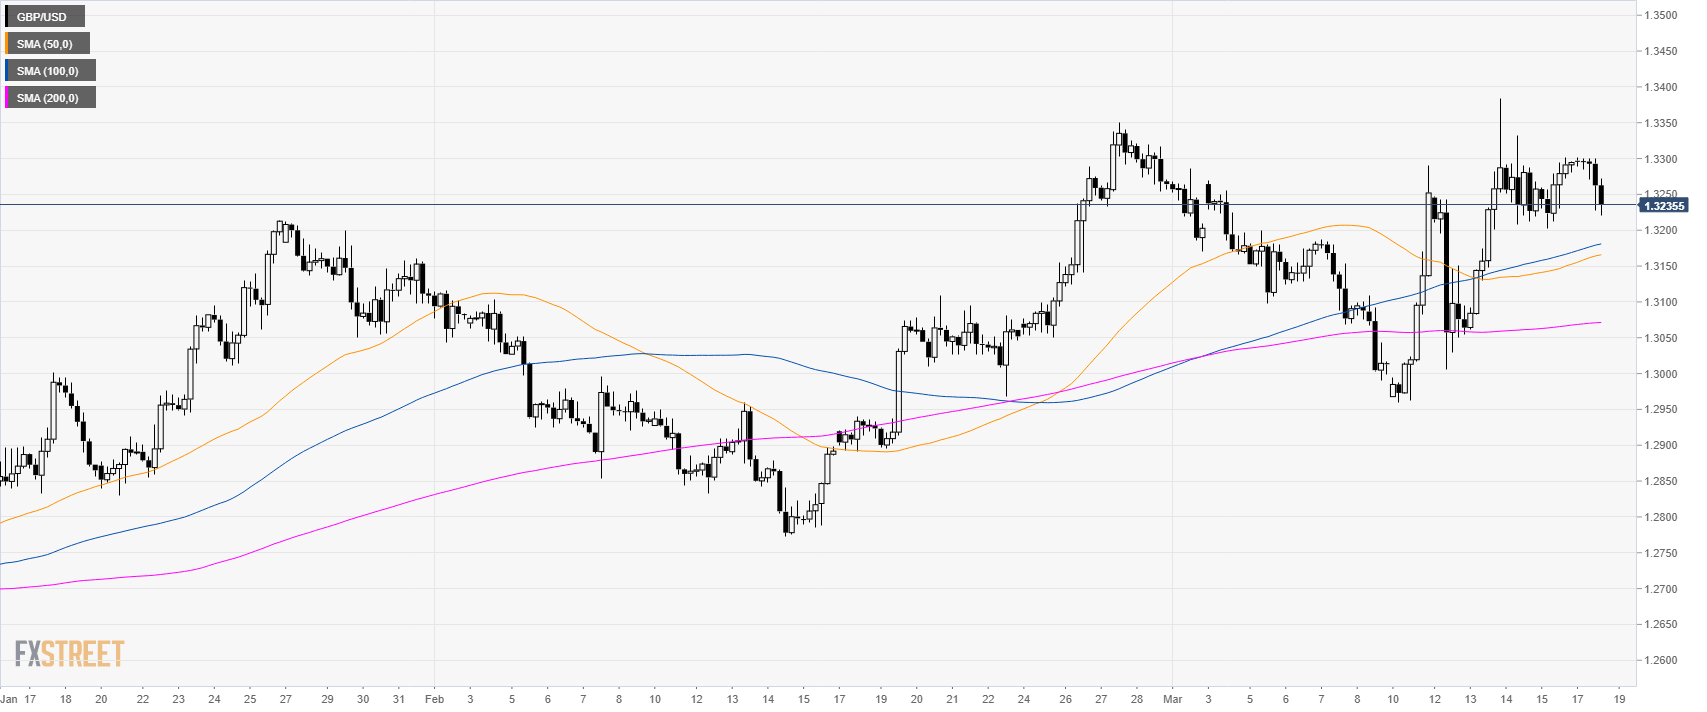
GBP/USD 4-hour chart

  • GBP/USD is trading above its main SMAs suggesting bullish momentum in the medium-term.


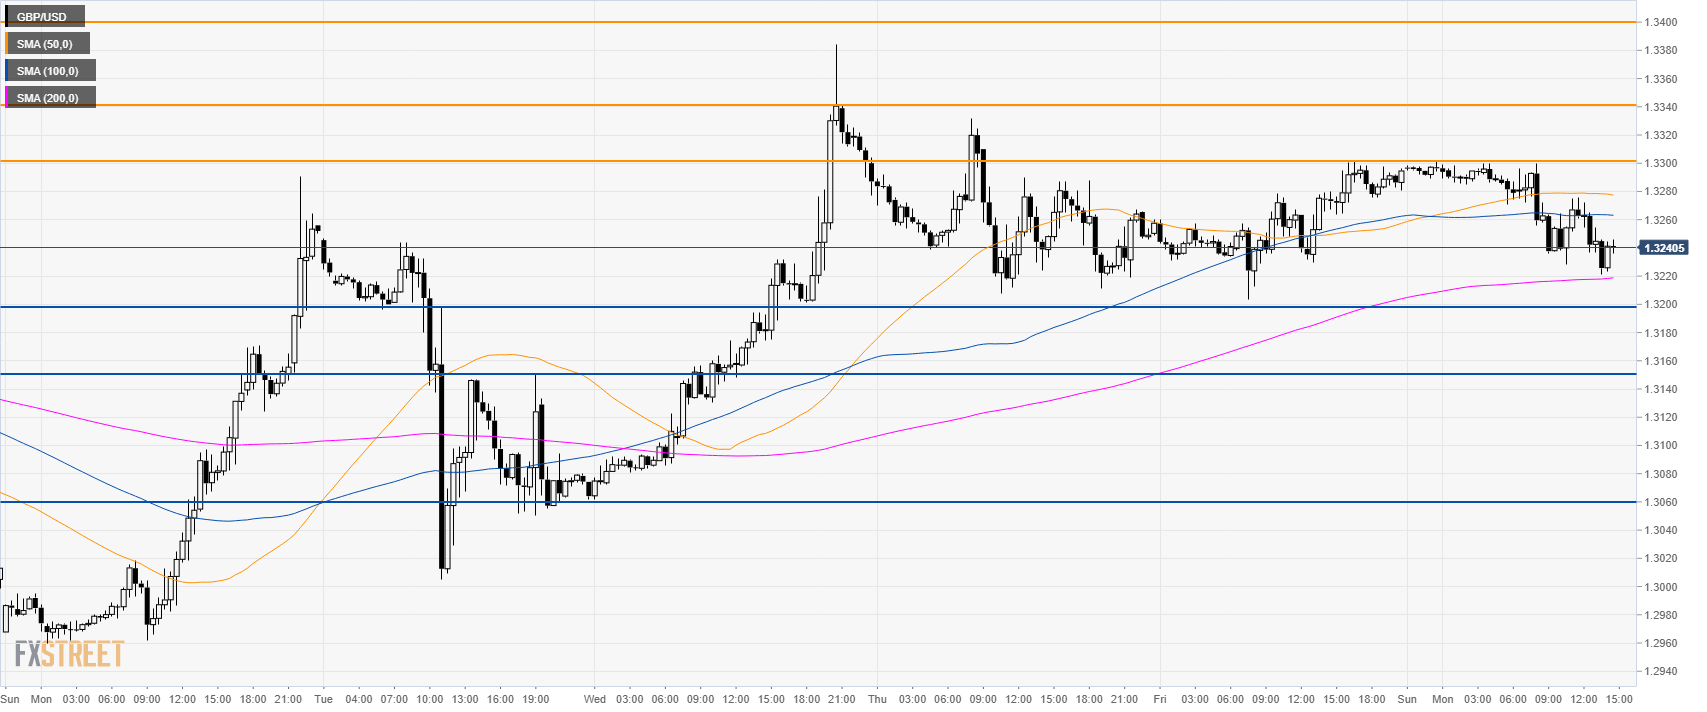
GBP/USD 30-minute chart

  • GBP/USD is trading between the 100 and 200 SMAs suggesting a consolidation phase.
  • A break below 1.3200 can lead to 1.3150 and 1.3060 support. 
  • To the upside, resistances are at 1.3300, 1.3340 and 1.3400 figure.


Additional key levels

GBP/USD

Overview:
    Today Last Price: 1.3242
    Today Daily change: -52 pips
    Today Daily change %: -0.39%
    Today Daily Open: 1.3294
Trends:
    Daily SMA20: 1.3149
    Daily SMA50: 1.3024
    Daily SMA100: 1.2899
    Daily SMA200: 1.2982
Levels:
    Previous Daily High: 1.3302
    Previous Daily Low: 1.3203
    Previous Weekly High: 1.3384
    Previous Weekly Low: 1.296
    Previous Monthly High: 1.3351
    Previous Monthly Low: 1.2773
    Daily Fibonacci 38.2%: 1.3264
    Daily Fibonacci 61.8%: 1.3241
    Daily Pivot Point S1: 1.3231
    Daily Pivot Point S2: 1.3168
    Daily Pivot Point S3: 1.3133
    Daily Pivot Point R1: 1.333
    Daily Pivot Point R2: 1.3365
    Daily Pivot Point R3: 1.3428

Author

Flavio Tosti

Flavio Tosti

Independent Analyst


More from Flavio Tosti
Share:

Editor's Picks

EUR/USD flat lines around 1.1900; looks to US NFP report for fresh directional impetus

The EUR/USD pair is seen oscillating in a narrow trading band around the 1.1900 mark during the Asian session on Wednesday as traders opt to wait for the release of US monthly employment details before placing fresh directional bets.

GBP/USD slips back to daily lows near 1.3640

GBP/USD drops to daily lows near 1.3640 as sellers push harder and the Greenback extends its rebound in the latter part of Tuesday’s session. Looking ahead, the combination of key US releases, including NFP and CPI, alongside important UK data, should keep the pound firmly in focus over the coming days.

Gold recovers to $5,050, focus shifts to US jobs data

Gold turns higher to test $5,050 in the Asian session on Wednesday. Traders assess whether Gold has found a floor following a historic sell-off. The delayed US employment report for January, which was pushed back due to the recently ended four-day government shutdown, will take center stage later on Wednesday.

Ethereum: Whales buy the dip amid rising short bets

Following one of Ethereum's largest weekly drawdowns, whales are slowly returning to action alongside a drop in retail selling pressure. After slightly selling into the decline at the start of the month, whales or wallets with a balance of 10K-100K ETH began buying the dip last Wednesday as prices crashed further. 

Dollar drops and stocks rally: The week of reckoning for US economic data

Following a sizeable move lower in US technology Stocks last week, we have witnessed a meaningful recovery unfold. The USD Index is in a concerning position; the monthly price continues to hold the south channel support.

XRP holds $1.40 amid ETF inflows and stable derivatives market

Ripple trades under pressure, with immediate support at $1.40 holding at the time of writing on Tuesday. A recovery attempt from last week’s sell-off to $1.12 stalled at $1.54 on Friday, leading to limited price action between the current support and the resistance.