|
GBP/USD technical analysis: Cable trading at daily lows after the London close
- GBP/USD is losing steam at the very end of the week but remains bullish in the medium term.
- The level to beat for buyers is the 1.2989 resistance.

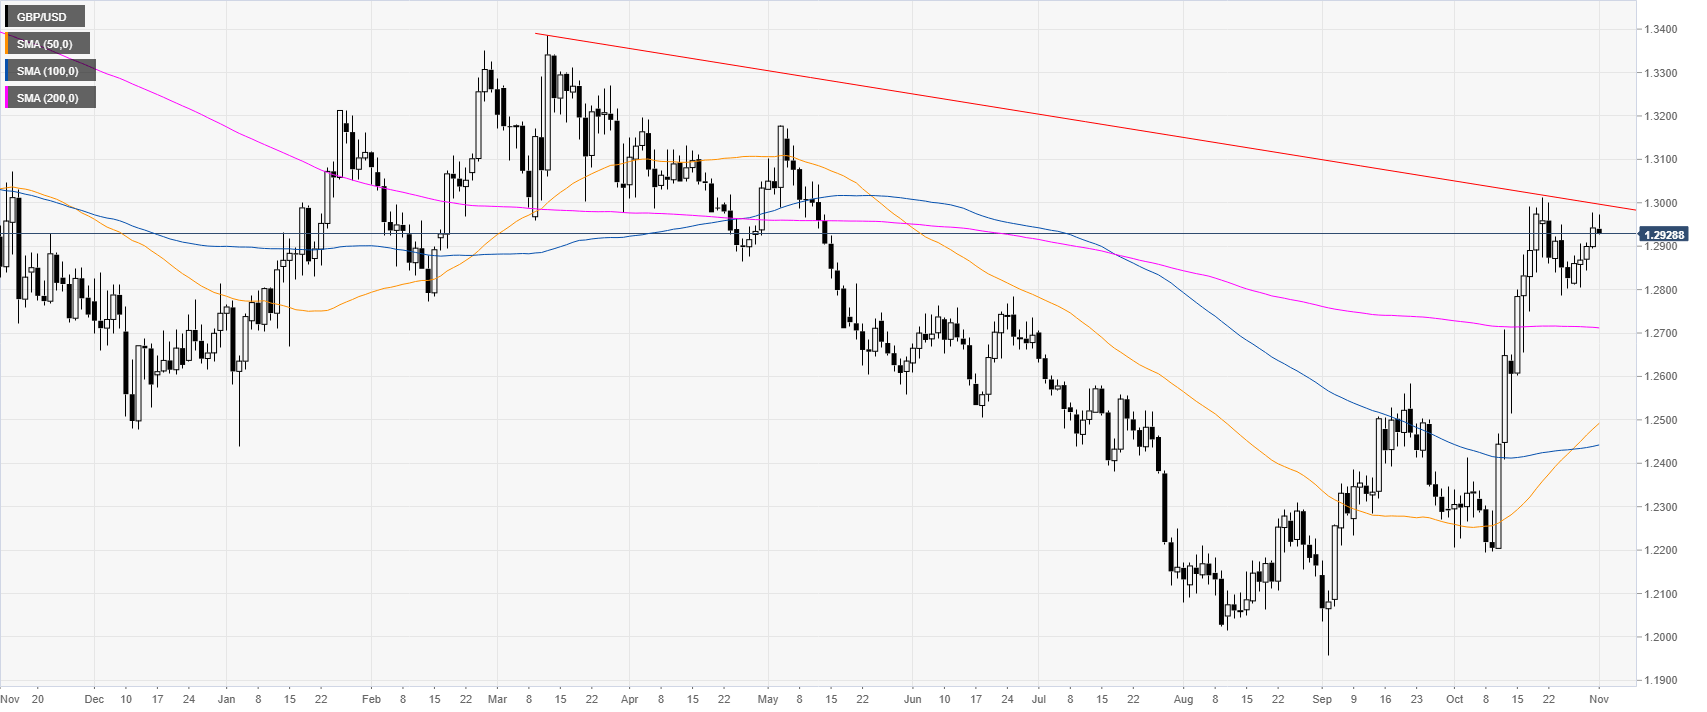
GBP/USD daily chart
GBP/USD in October soared above its main daily simple moving averages (DMAs) and reached levels not seen since mid-May 2019. Buyers want a daily close above the 1.3000 handle and the October high at the 1.3013 level.
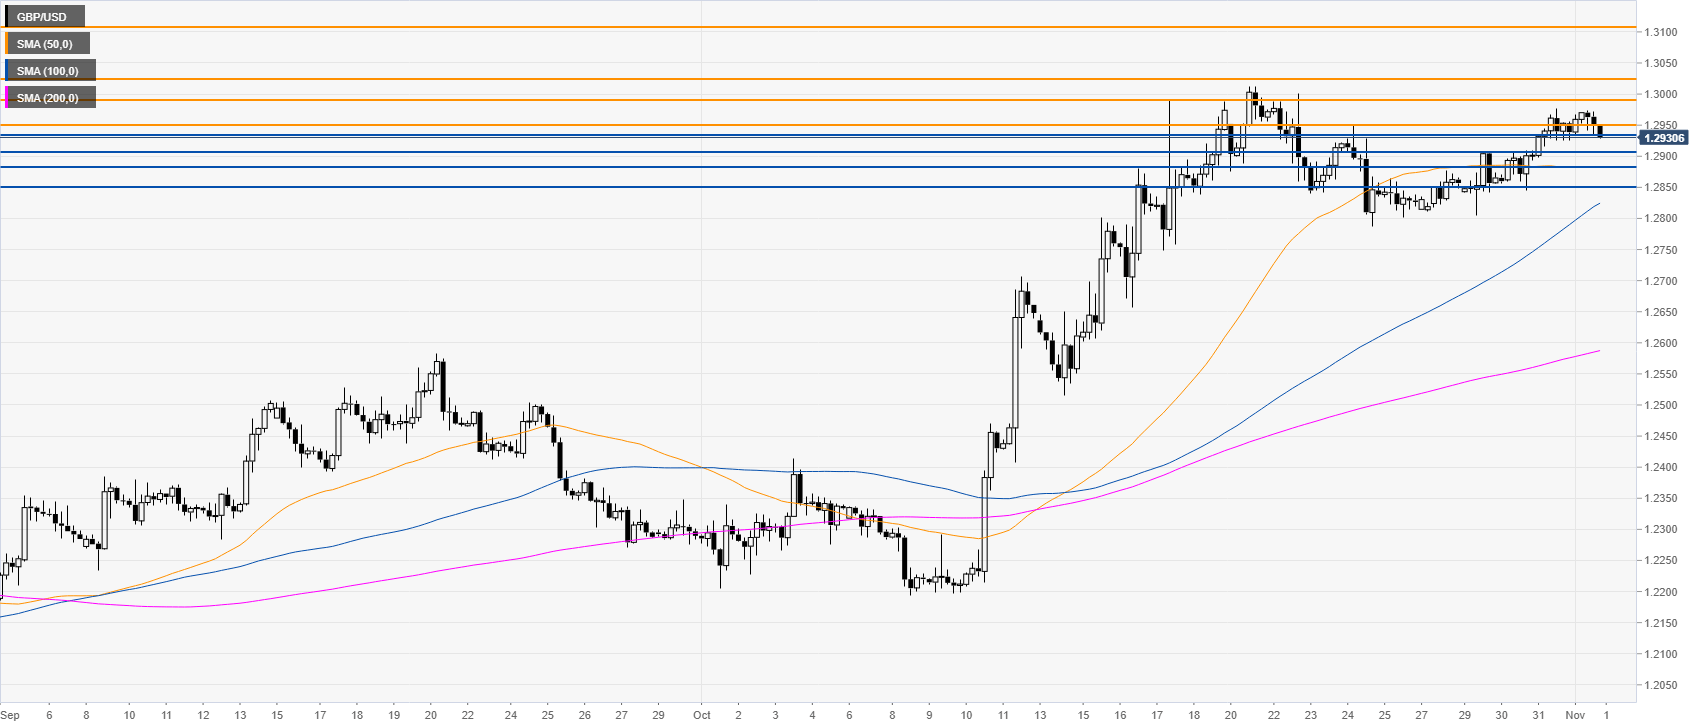
GBP/USD four-hour chart
GBP/USD is trading above the 1.2900 figure and its main SMAs on the four-hour chart, suggesting a bullish bias in the medium term. Buyers want a break of the 1.2989 resistance to open the doors to additional gains towards the 1.3024 level and the 1.3100 handle.
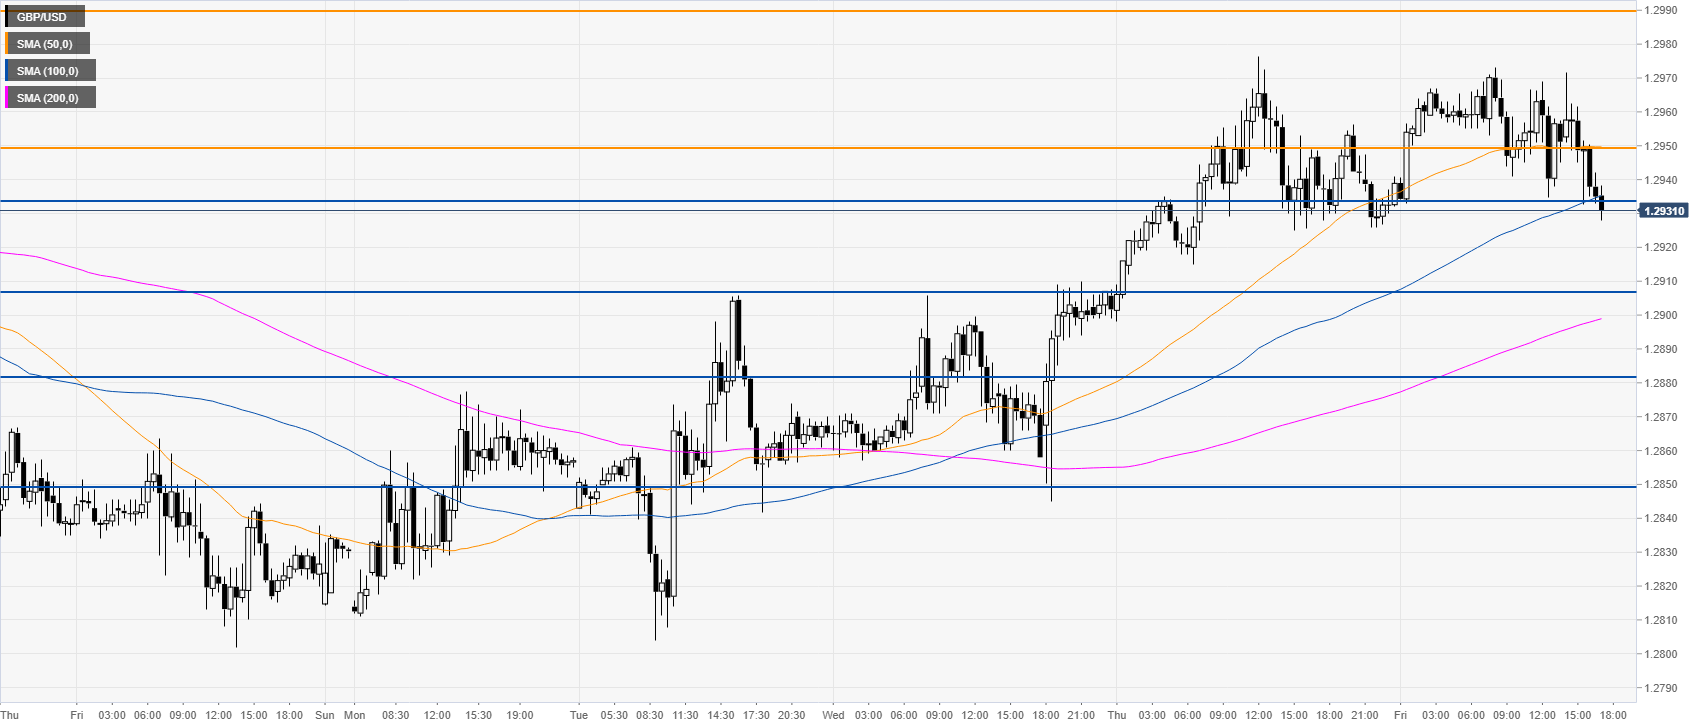
GBP/USD 30-minute chart
Sterling/Dollar is trading at daily lows after a dull London session. The market is challenging the 1.2934 support and the 100 SMA. The bias remains firmly bullish on the Pound and sellers will need to do more to regain control. A daily close below 1.2880 and the 200 SMA could be seen as a bearish sign. However, next week it will be interesting to see if the bulls can break the 1.2989 resistance.
Additional key levels
Author

Flavio Tosti
Independent Analyst
More from Flavio Tosti


