|
GBP/USD technical analysis: Cable spikes to 1.2296 on Brexit deal hopes
- GBP/USD jumps as Johnson and Varadkar see pathway for a Brexit deal.
- GBP/USD is challenging the 1.2383 resistance.

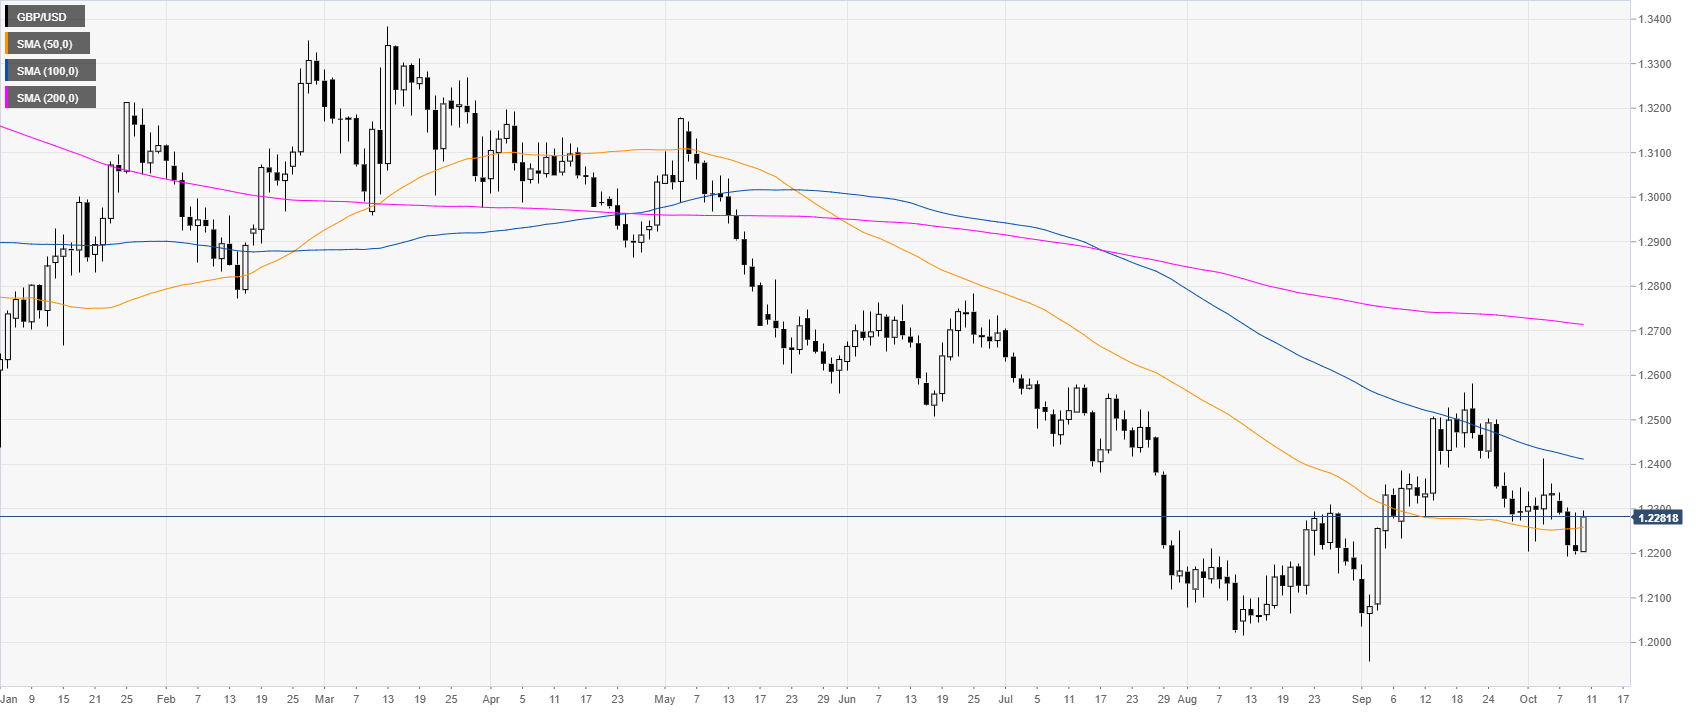
GBP/USD daily chart
On the daily chart, the Cable is trading in a bear trend below the main daily simple moving averages (DSMAs). GBP/USD jumps as Johnson and Varadkar see pathway for a Brexit deal.
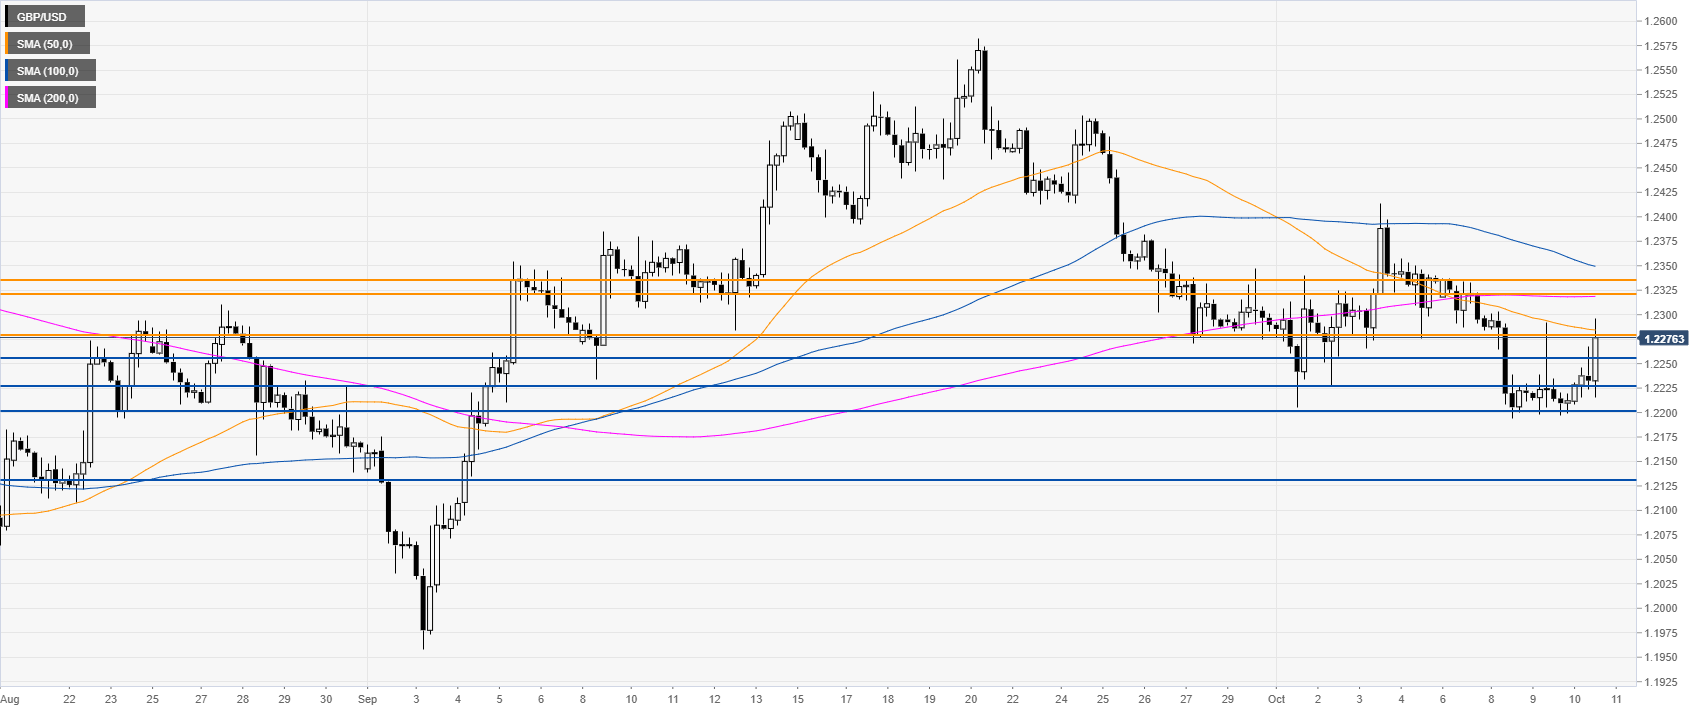
GBP/USD four-hour chart
GBP/USD is challenging the 1.2283 resistance and the 50 SMA as the market is rebounding from the October lows. A break above the current resistance can lead to further strength towards the 1.2320/35 resistance zone, according to the Technical Confluences Indicator.
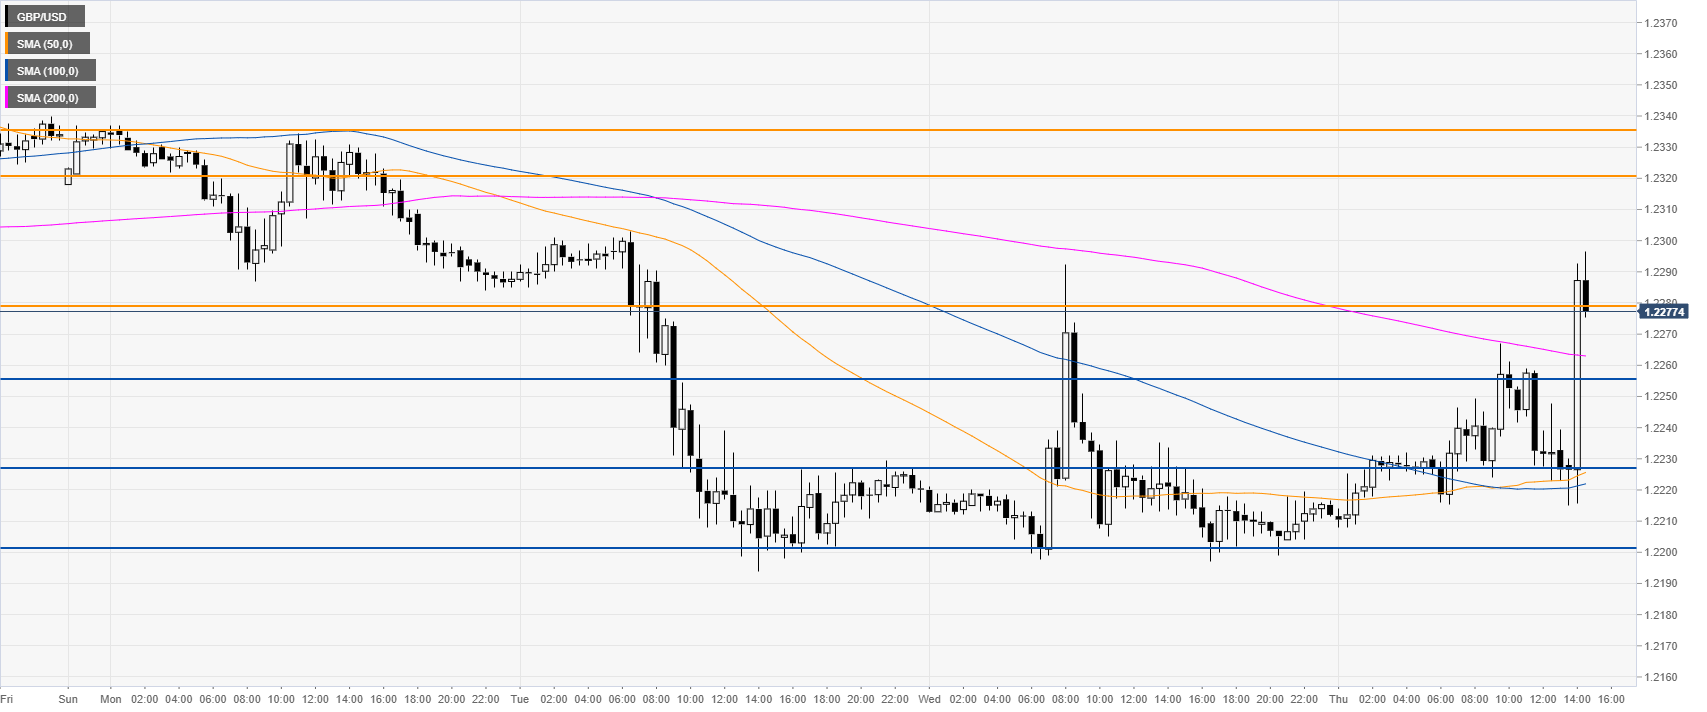
GBP/USD 30-minute chart
The Sterling is trading above the main SMAs, suggesting bullish momentum in the near term. Support is seen at the 1.2253 and 1.2226 price levels, according to the Technical Confluences Indicator.
Additional key levels
Author

Flavio Tosti
Independent Analyst
More from Flavio Tosti


