|
GBP/USD technical analysis: Cable holding above the 1.2700 handle
- GBP/USD is in a small correction down holding above 1.2700 handle.
- Support is seen at 1.2700 and 1.2660 according to the Technical Confluences Indicator.

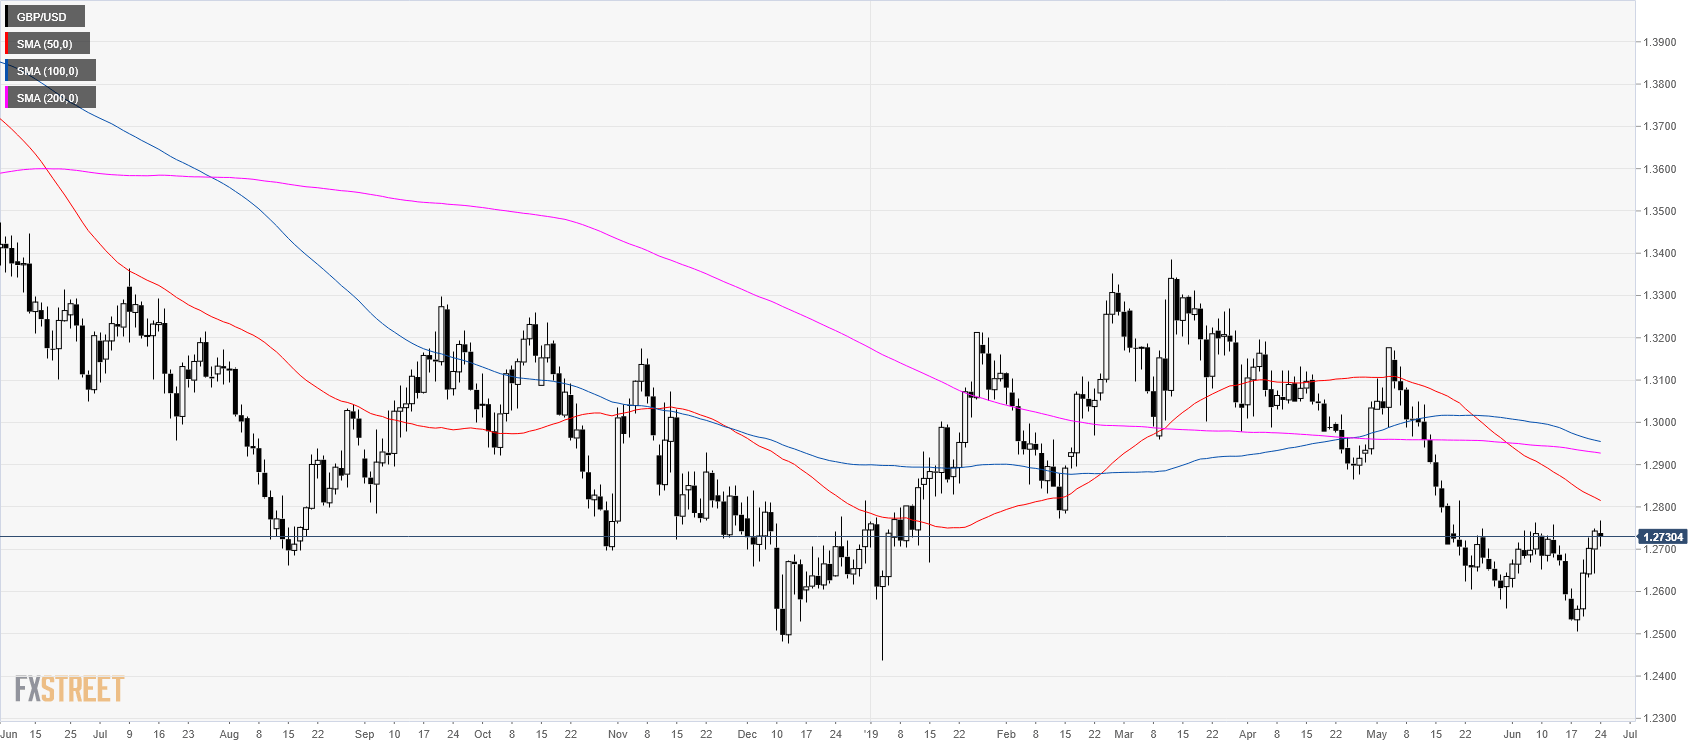
GBP/USD daily chart
GBP/USD is trading in a bear trend below its main daily simple moving averages. (DSMAs) The market is currently finding some resistance below the 1.2800 handle.
GBP/USD 4-hour chart
Cable is trading above its main SMAs suggesting bullish momentum in the near term. The next resistances to the upside are located at 1.2800 and 1.2825 according to the Technical Confluences Indicator.
-636969908483350941.png&w=1536&q=95)
GBP/USD 30-minute chart
-636969908483350941.png)
GBP/USD is trading below the 50 SMA suggesting a potential correction down in the near term. Support is at the 1.2700 and 1.2660 levels according to the Technical Confluences Indicator.
-636969909322731066.png)
Additional key levels
Author

Flavio Tosti
Independent Analyst
More from Flavio Tosti


