|

GBP/USD Technical Analysis: Cable falling from daily highs as bears challenge 1.2950 level
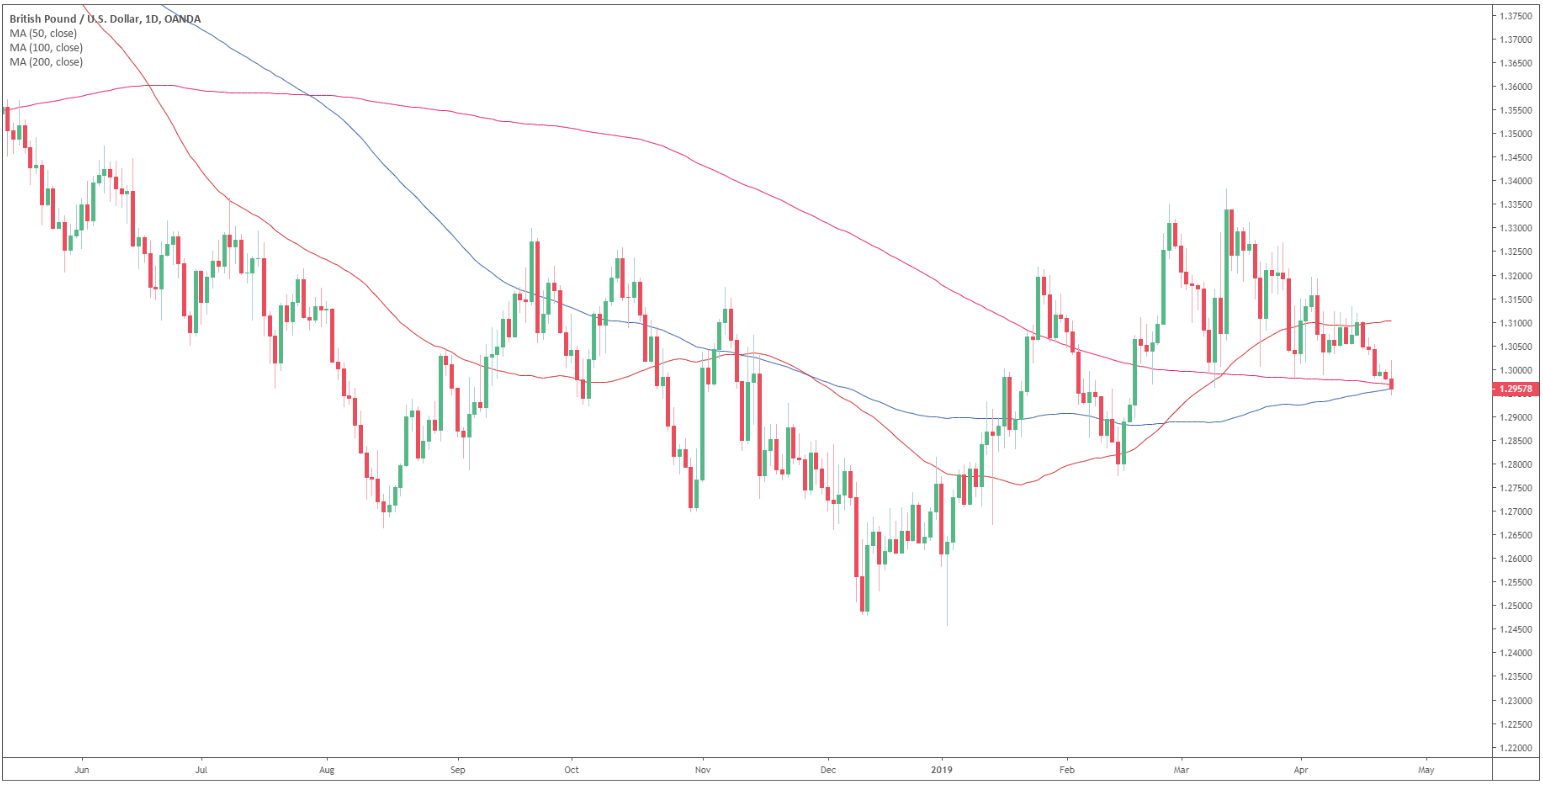
GBP/USD daily chart

  • GBP/USD is trading below its 200-day simple moving average (SMA).


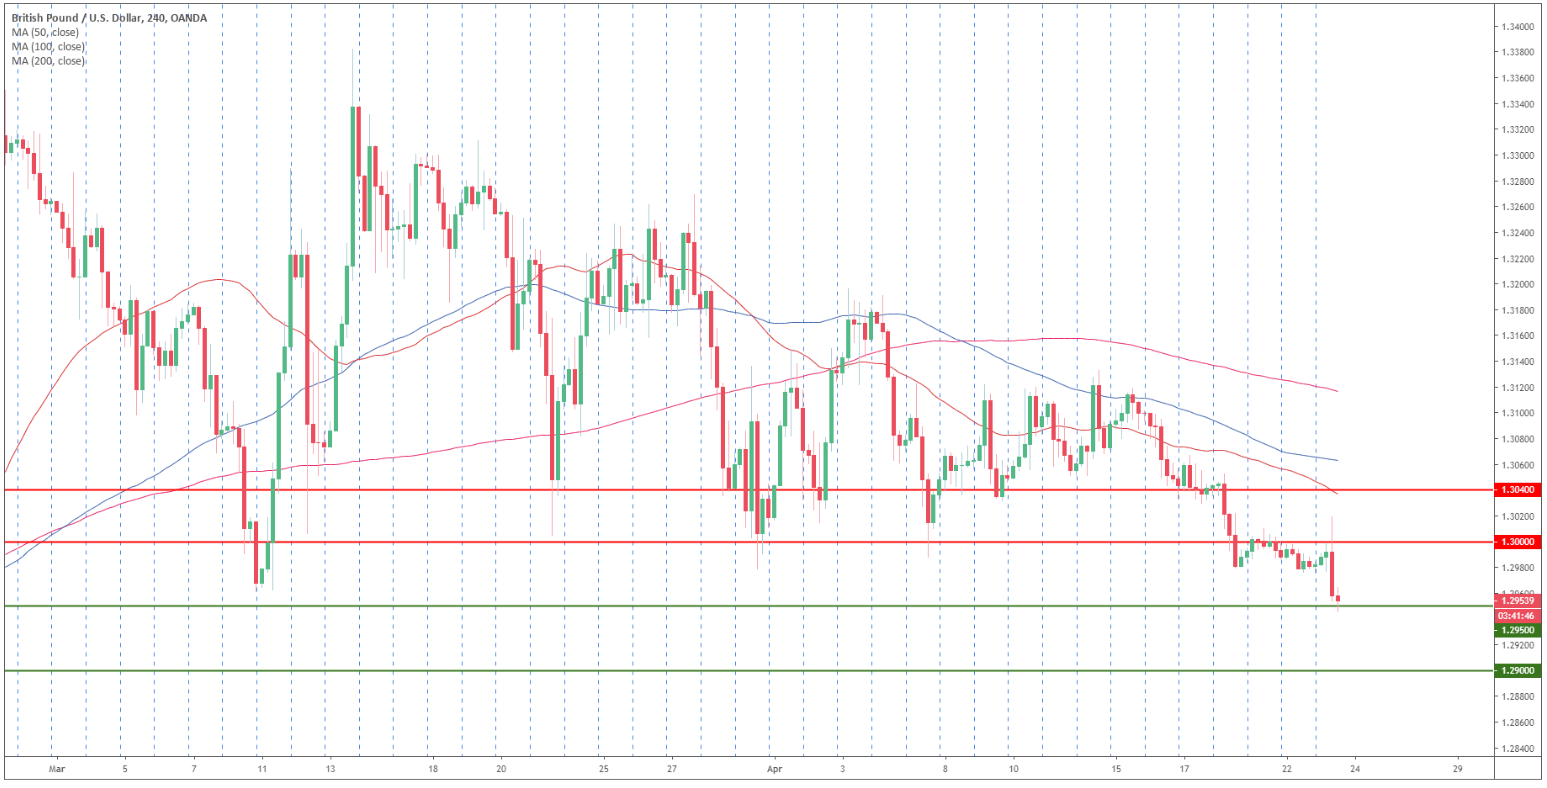
GBP/USD 4-hour chart

  • GBP/USD is trading below its main SMAs suggesting bearish momentum in the medium-term.


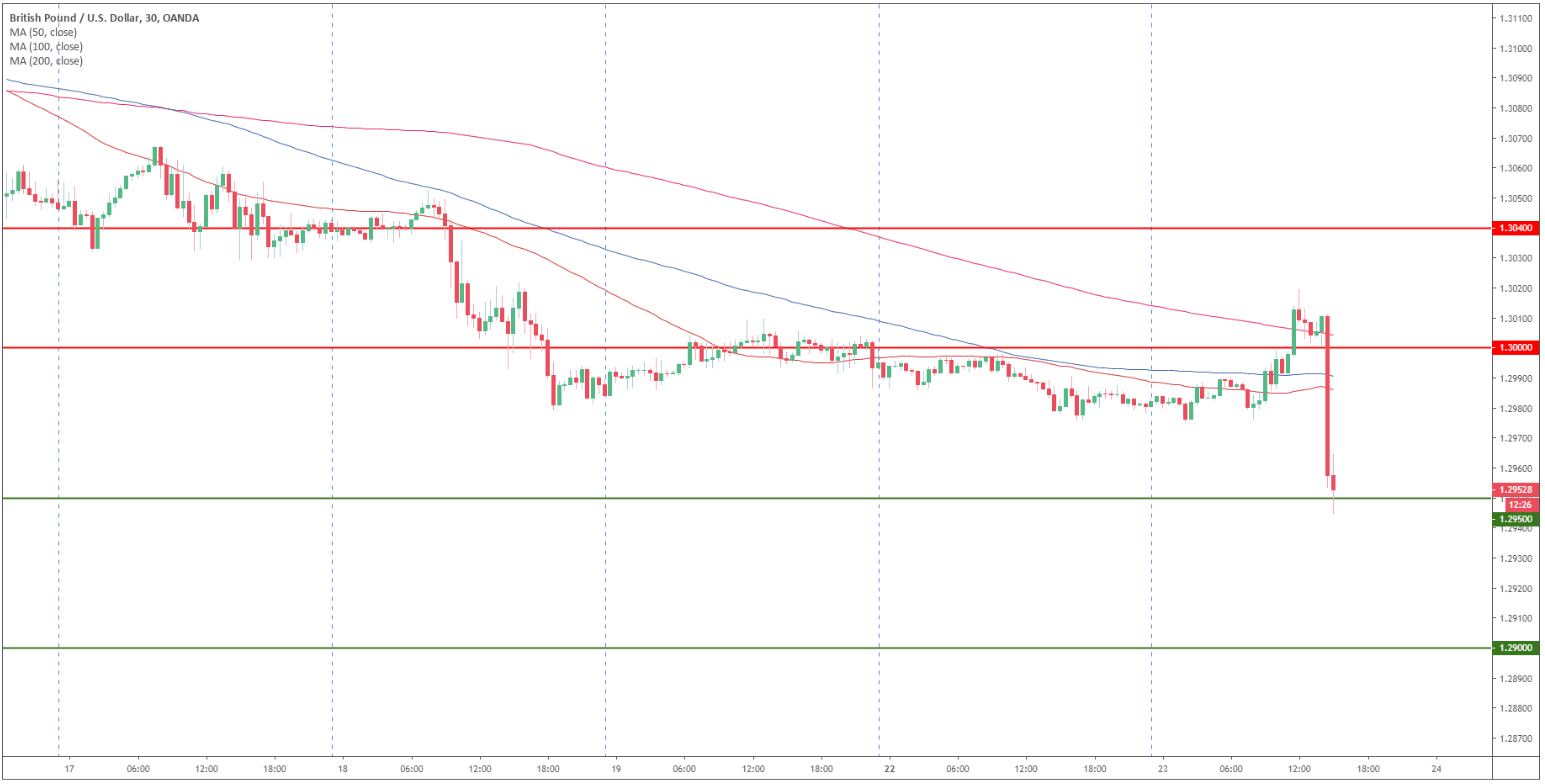
GBP/USD 30-minute chart

  • The market is trading below its main SMAs suggesting a bearish bias in the short-term. 
  • A break below 1.2950 support should open the gates to 1.2900 figure. 
  • Strong resistance is seen at 1.3000 figure and 1.3040 level. 

Additional key levels

GBP/USD

Overview
Today last price1.2955
Today Daily Change-0.0025
Today Daily Change %-0.19
Today daily open1.298
 
Trends
Daily SMA201.3073
Daily SMA501.3102
Daily SMA1001.2959
Daily SMA2001.2965
Levels
Previous Daily High1.3001
Previous Daily Low1.2975
Previous Weekly High1.312
Previous Weekly Low1.2978
Previous Monthly High1.3384
Previous Monthly Low1.296
Daily Fibonacci 38.2%1.2985
Daily Fibonacci 61.8%1.2991
Daily Pivot Point S11.297
Daily Pivot Point S21.296
Daily Pivot Point S31.2944
Daily Pivot Point R11.2995
Daily Pivot Point R21.3011
Daily Pivot Point R31.3021

Author

Flavio Tosti

Flavio Tosti

Independent Analyst


More from Flavio Tosti
Share:

Editor's Picks

EUR/USD off highs, back to 1.1850

EUR/USD loses some upside momentum, returning to the 1.1850 region amid humble losses. The pair’s slight decline comes against the backdrop of a marginal advance in the US Dollar as investors continue to assess the latest US CPI readings.

GBP/USD advances to daily tops around 1.3650

GBP/USD now manages to pick up extra pace, clinching daily highs around 1.3650 and leaving behind three consecutive daily pullbacks on Friday. Cable’s improved sentiment comes on the back of the inconclusive price action of the Greenback, while recent hawkish comments from the BoE’s Pill also collaborates with the uptick.

Gold surpasses $5,000/oz, daily highs

Gold is reclaiming part of the ground lost on Wednesday’s marked decline, as bargain-hunters keep piling up and lifting prices past the key $5,000 per troy ounce. The yellow metal’s upside is also propped up by the lack of clear direction around the US Dollar post-US CPI release.

Crypto Today: Bitcoin, Ethereum, XRP in choppy price action, weighed down by falling institutional interest 

Bitcoin's upside remains largely constrained amid weak technicals and declining institutional interest. Ethereum trades sideways above $1,900 support with the upside capped below $2,000 amid ETF outflows.

Week ahead – Data blitz, Fed Minutes and RBNZ decision in the spotlight

US GDP and PCE inflation are main highlights, plus the Fed minutes. UK and Japan have busy calendars too with focus on CPI. Flash PMIs for February will also be doing the rounds. RBNZ meets, is unlikely to follow RBA’s hawkish path.

Ripple Price Forecast: XRP potential bottom could be in sight

Ripple edges up above the intraday low of $1.35 at the time of writing on Friday amid mixed price actions across the crypto market. The remittance token failed to hold support at $1.40 the previous day, reflecting risk-off sentiment amid a decline in retail and institutional sentiment.