|

GBP/USD Technical Analysis: Cable directionless amidst Brexit chaos
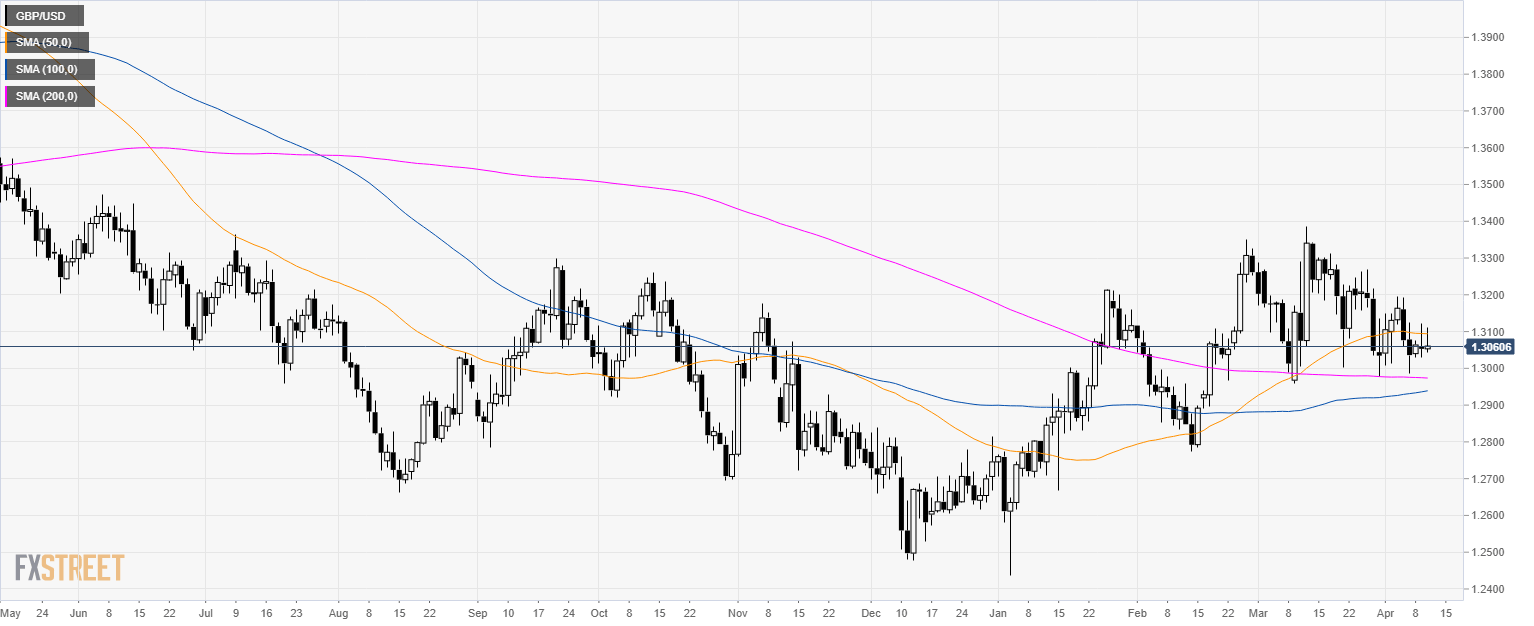
GBP/USD daily chart

  • GBP/USD is consolidating above the 200-day simple moving average (SMA) while rejecting the 1.3100 level and the 50 SMA.


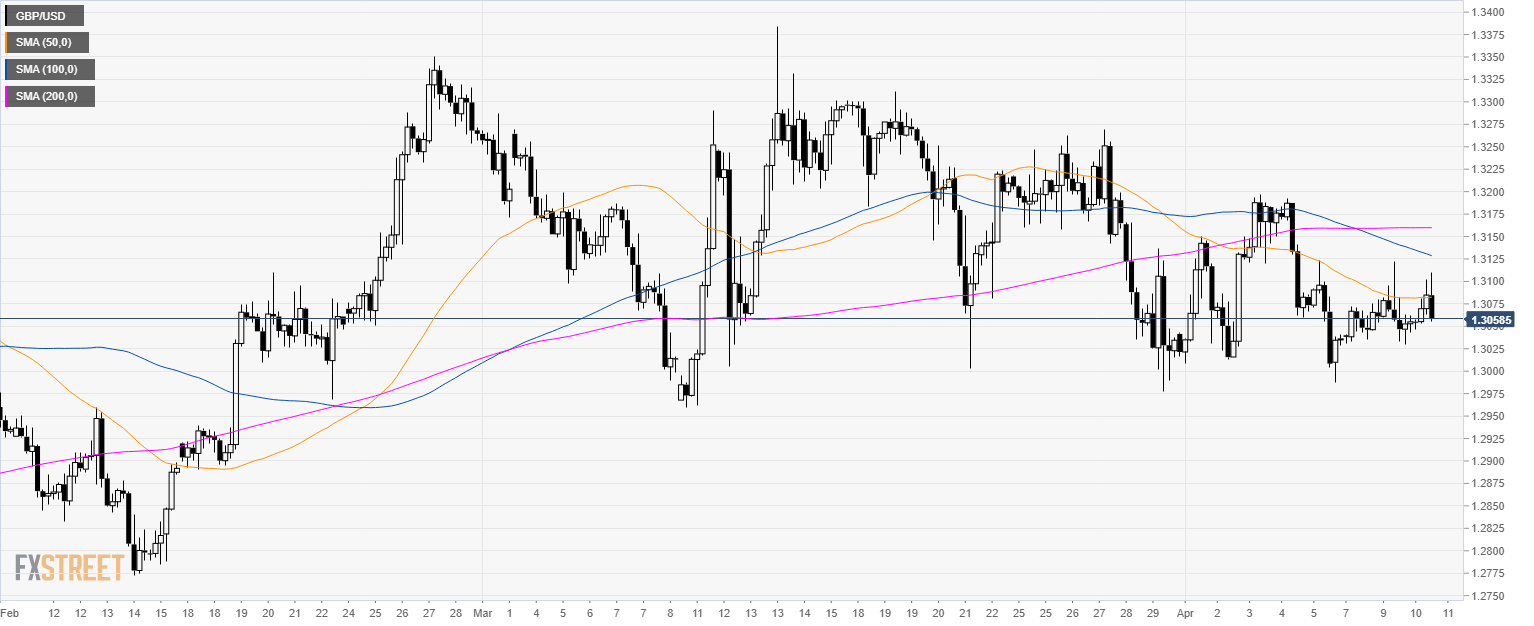
GBP/USD 4-hour chart

  • GBP/USD is trading below its main SMAs suggesting bearish momentum in the medium-term.

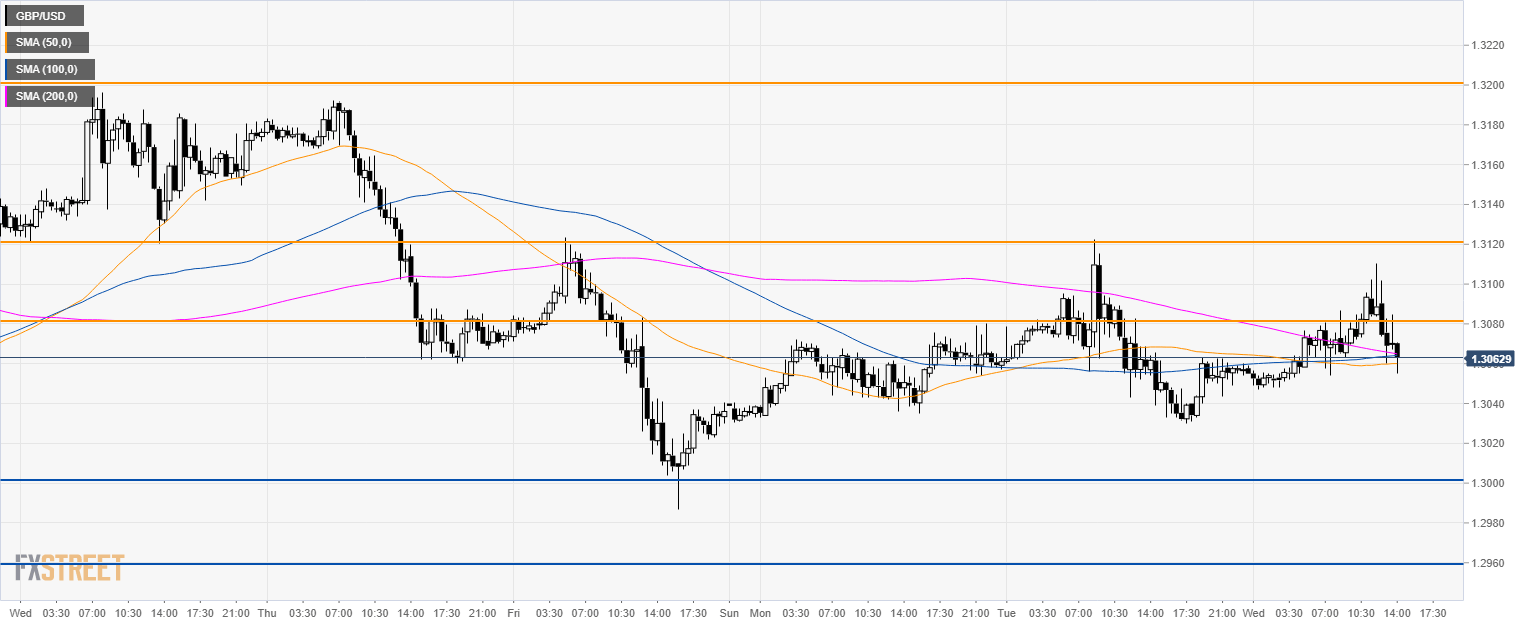
GBP/USD 30-minute chart

  • GBP/USD is trading below its main SMAs suggesting bearish momentum in the short-term.
  • The main support to the downside is seen at 1.3000 and 1.2960 level.
  • Immediate resistance is seen at 1.3080 and 1.3120 level.

Additional key levels

GBP/USD

Overview
Today last price1.3058
Today Daily Change0.0005
Today Daily Change %0.04
Today daily open1.3053
 
Trends
Daily SMA201.3161
Daily SMA501.3095
Daily SMA1001.2936
Daily SMA2001.2974
Levels
Previous Daily High1.3122
Previous Daily Low1.303
Previous Weekly High1.3196
Previous Weekly Low1.2987
Previous Monthly High1.3384
Previous Monthly Low1.296
Daily Fibonacci 38.2%1.3065
Daily Fibonacci 61.8%1.3087
Daily Pivot Point S11.3014
Daily Pivot Point S21.2976
Daily Pivot Point S31.2922
Daily Pivot Point R11.3107
Daily Pivot Point R21.3161
Daily Pivot Point R31.3199

Author

Flavio Tosti

Flavio Tosti

Independent Analyst


More from Flavio Tosti
Share:

Editor's Picks

EUR/USD treads water around 1.1900

EUR/USD edges a tad lower around the 1.1900 area, coming under mild pressure despite the US Dollar keeps the offered stance on turnaround Tuesday. On the US data front, December Retail Sales fell short of expectations, while the ADP four week average printed at 6.5K.

GBP/USD looks weak near 1.3670

GBP/USD trades on the back foot around the 1.3670 region on Tuesday. Cable’s modest retracement also comes in tandem with the decent decline in the Greenback. Moving forward, the US NFP and CPI data in combination with key UK releases should kee the quid under scrutiny in the next few days.

Gold the battle of wills continues with bulls not ready to give up

Gold comes under marked selling pressure on Tuesday, giving back part of its recent two day advance and threatening to challenge the key $5,000 mark per troy ounce. The yellow metal’s correction follows a better tone in the risk complex, a lower Greenback and shrinking US Treasuty yields.

AI Crypto Update: BankrCoin, Pippin surge as sector market cap steadies above $12B

The Artificial Intelligence (AI) segment is largely on the back foot with major coins such as Bittensor (TAO) and Internet Computer (ICP) extending losses amid a sticky risk-off sentiment.

Dollar drops and stocks rally: The week of reckoning for US economic data

Following a sizeable move lower in US technology Stocks last week, we have witnessed a meaningful recovery unfold. The USD Index is in a concerning position; the monthly price continues to hold the south channel support.

XRP holds $1.40 amid ETF inflows and stable derivatives market

Ripple trades under pressure, with immediate support at $1.40 holding at the time of writing on Tuesday. A recovery attempt from last week’s sell-off to $1.12 stalled at $1.54 on Friday, leading to limited price action between the current support and the resistance.