|
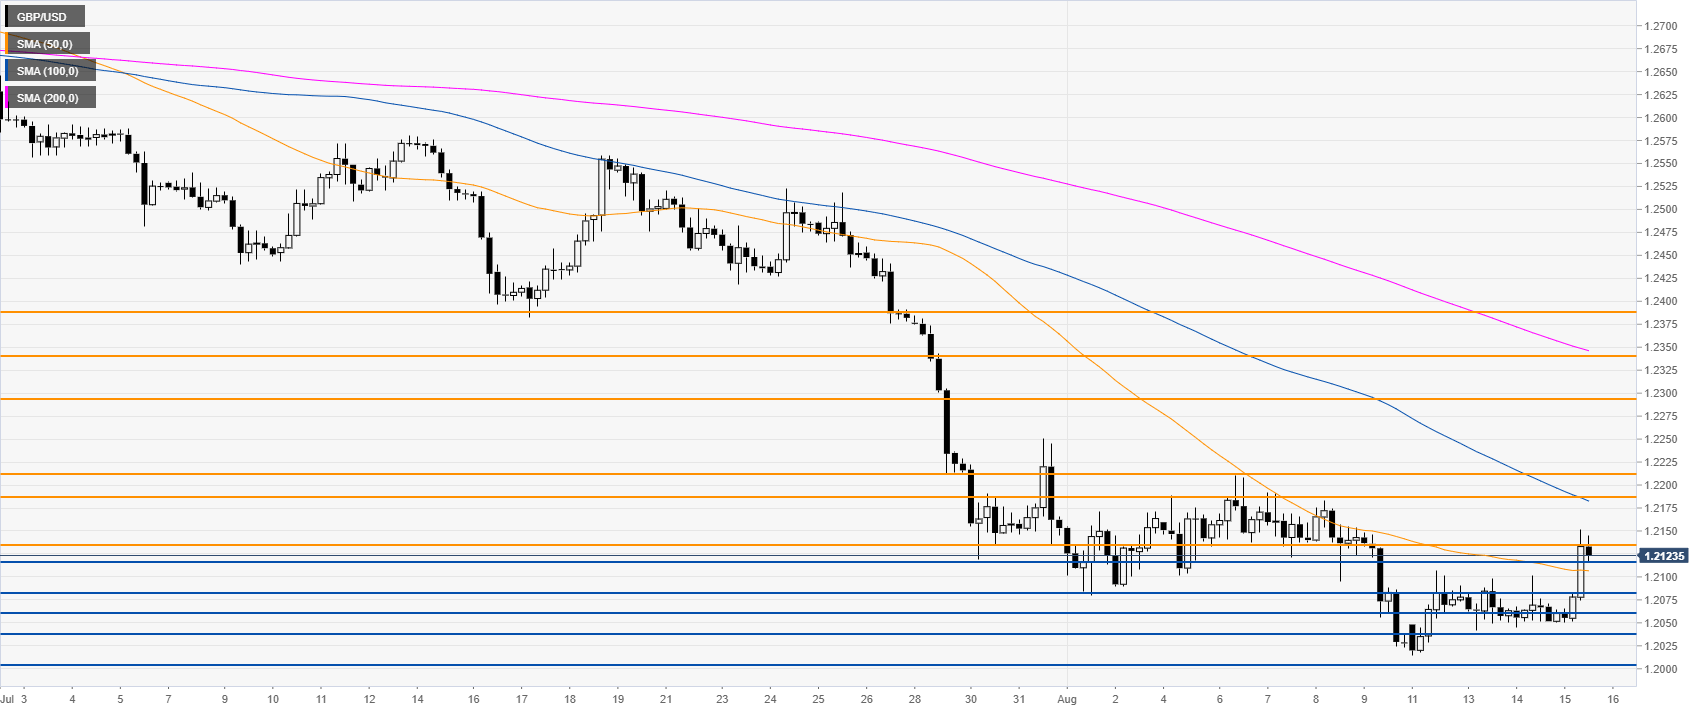
GBP/USD technical analysis: Cable clings to 4-day highs above the 1.2116 level
- The market is consolidating the intraday gains near daily highs.
- The market reached 4-day highs to 1.2151 as the UK Retail Sales beat expectations.

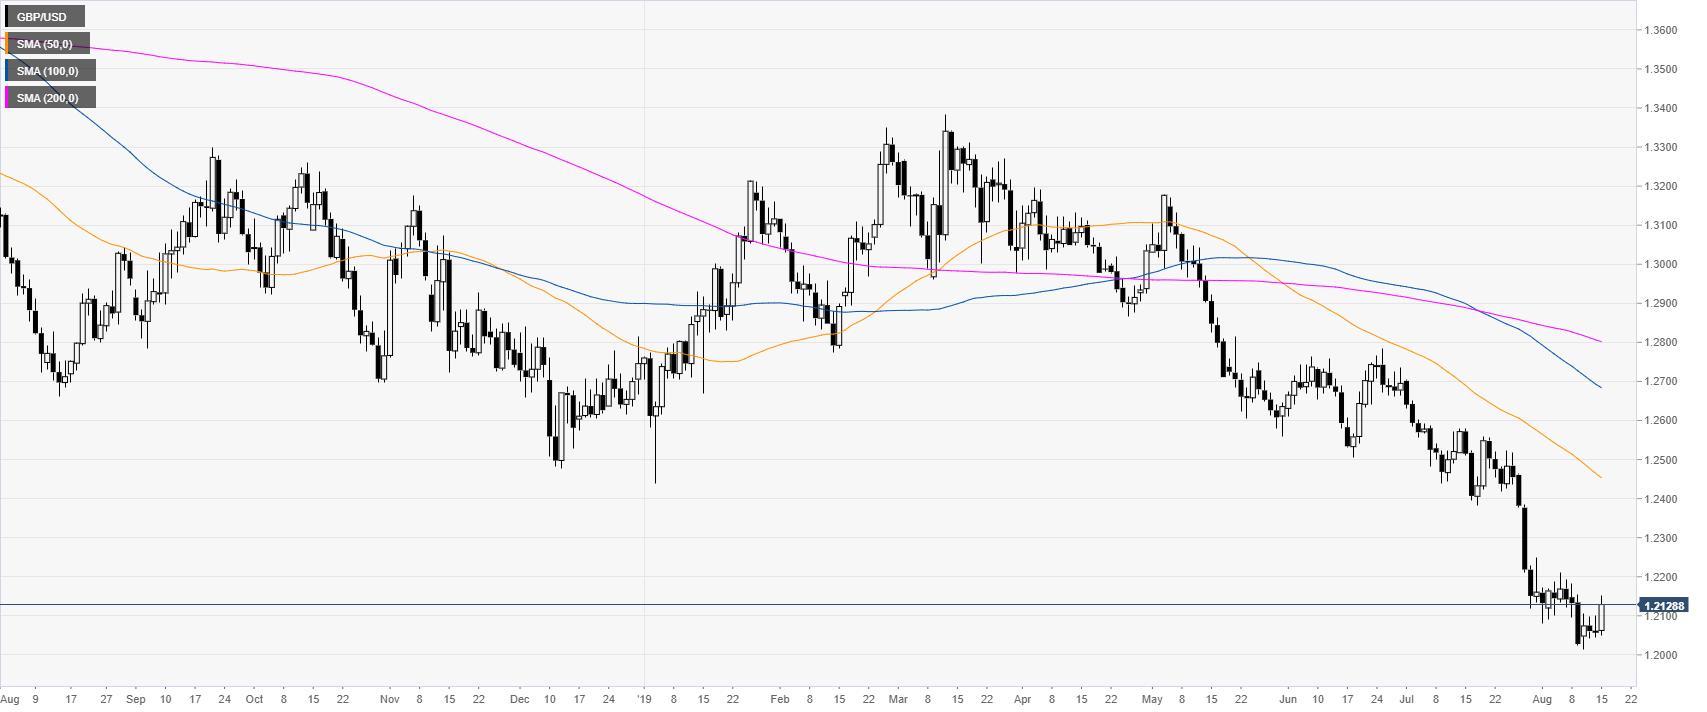
GBP/USD daily chart
The Cable is trading above the 1.2100 mark. Earlier in the London session, the UK Retail Sales data surprised to the upside at 2.9% vs. 2.3% in July (YoY). The Sterling rose sharply against the USD after the release of the data.
GBP/USD 4-hour chart
GBP/USD is trading between the 50 and 100 SMA, suggesting a consolidation in the medium term. An extension of the correction up could see the 1.2187 and 1.2212 resistances challenged, according to the Technical Confluences Indicator.
GBP/USD 30-minute chart
It is unclear if the reaction to the news was an overaction. In the short term, if the market retraces down, it could find potential support at 1.2116, 1.2082 and 1.2060, according to the Technical Confluences Indicator.

Additional key levels
Author

Flavio Tosti
Independent Analyst
More from Flavio Tosti


