|

GBP/USD Technical Analysis: Cable bears en route to 1.2500 figure and a new 2018 low

EUR/USD daily chart

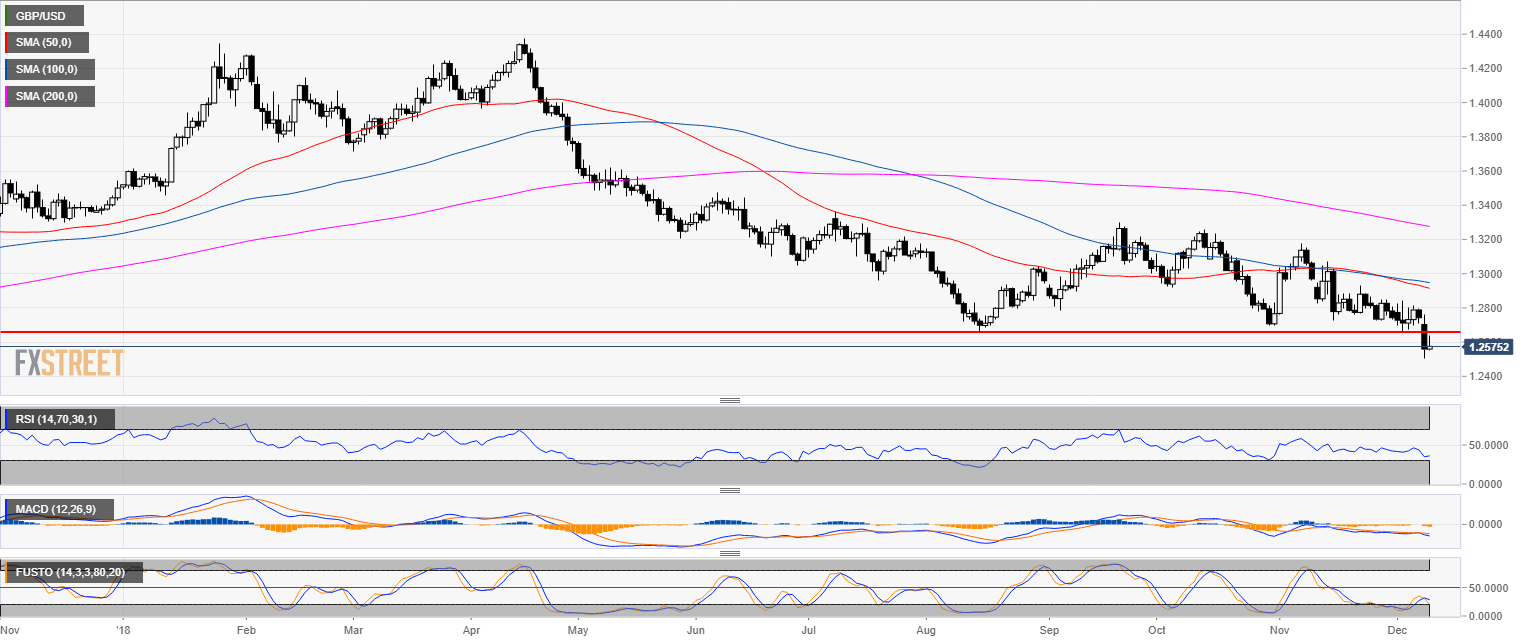
  • GBP/USD is trading in a bear trend below the 50, 100 and 200-day simple moving average (SMA).
  • GBP/USD broke a multi-month support yesterday (Monday December 10).

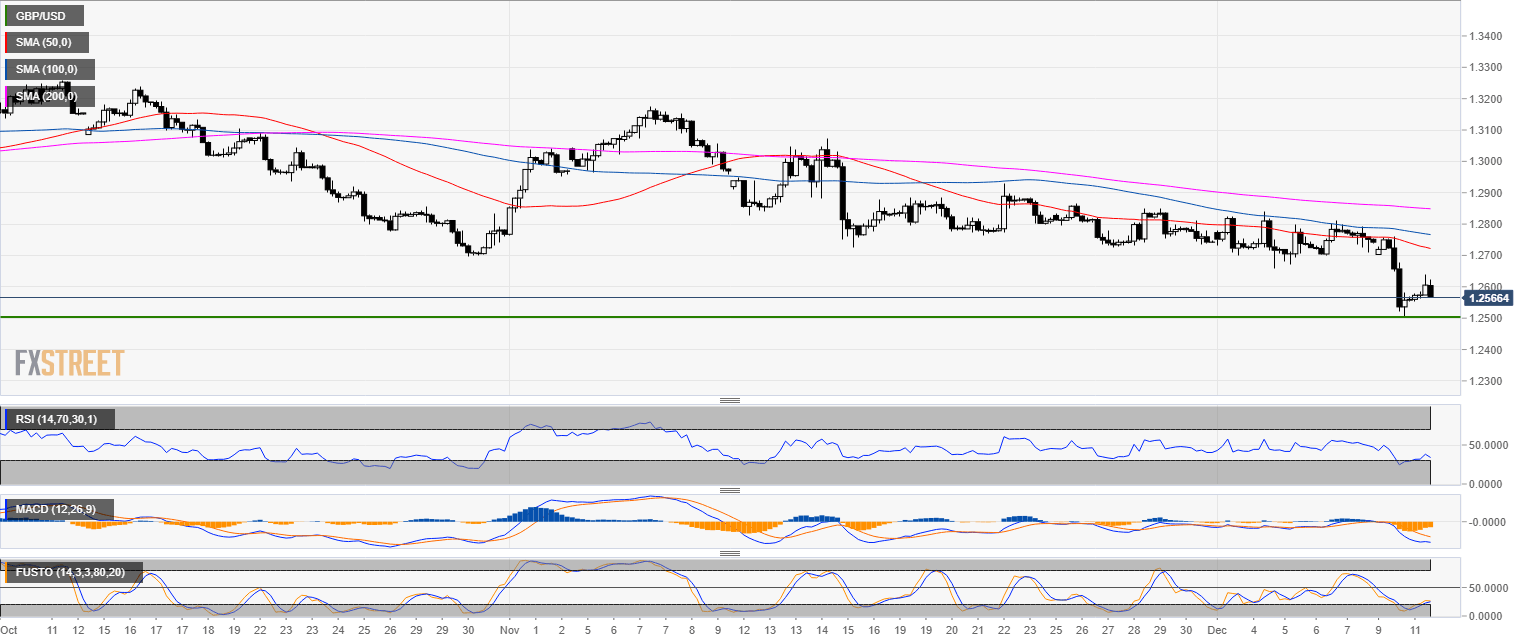
GBP/USD 4-hour chart

  • GBP/USD is strongly bearish.

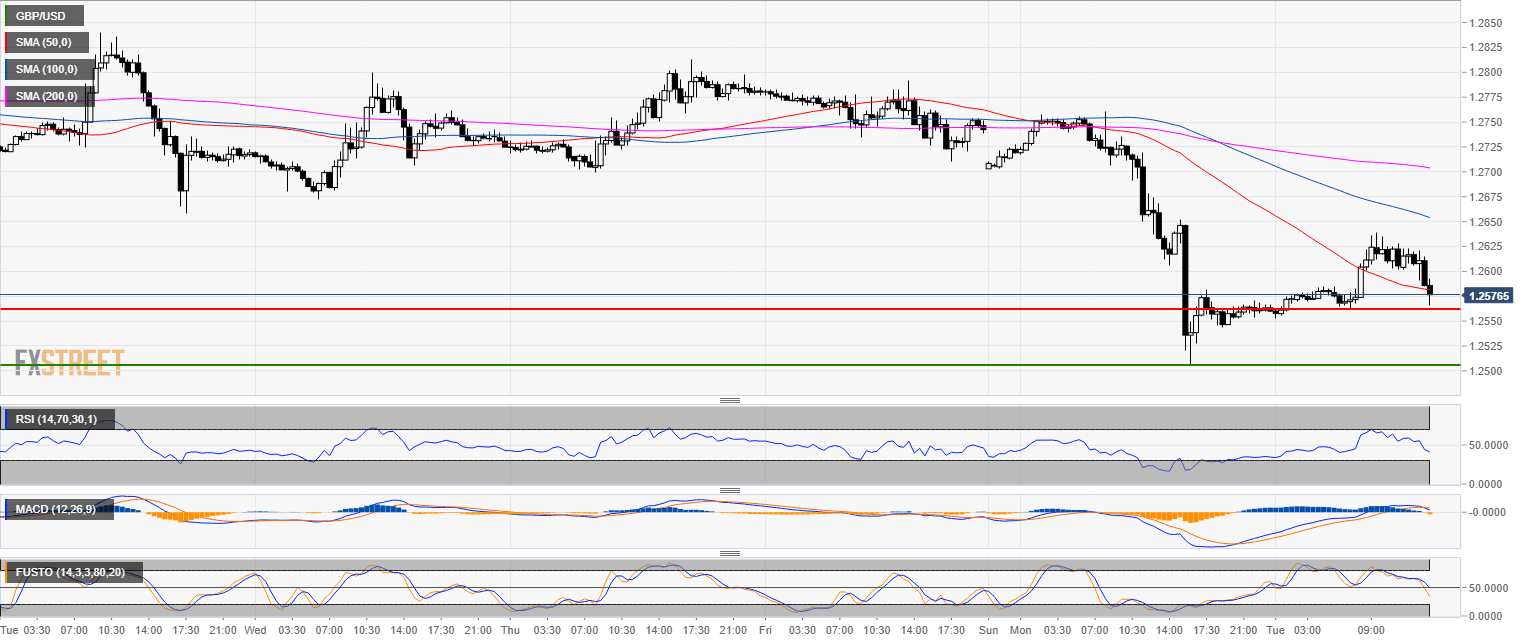
GBP/USD 30-minute chart

  • The 1.2560 support is the last bastion for bears. 
  • If 1.2560 is broken, the 1.2500 figure is likely the next destination for Cable. 

Additional key levels

GBP/USD

Overview:
    Today Last Price: 1.2586
    Today Daily change: 27 pips
    Today Daily change %: 0.215%
    Today Daily Open: 1.2559
Trends:
    Previous Daily SMA20: 1.2792
    Previous Daily SMA50: 1.2922
    Previous Daily SMA100: 1.2953
    Previous Daily SMA200: 1.3281
Levels:
    Previous Daily High: 1.276
    Previous Daily Low: 1.2507
    Previous Weekly High: 1.284
    Previous Weekly Low: 1.2659
    Previous Monthly High: 1.3176
    Previous Monthly Low: 1.2723
    Previous Daily Fibonacci 38.2%: 1.2604
    Previous Daily Fibonacci 61.8%: 1.2663
    Previous Daily Pivot Point S1: 1.2457
    Previous Daily Pivot Point S2: 1.2355
    Previous Daily Pivot Point S3: 1.2204
    Previous Daily Pivot Point R1: 1.2711
    Previous Daily Pivot Point R2: 1.2862
    Previous Daily Pivot Point R3: 1.2964

Author

Flavio Tosti

Flavio Tosti

Independent Analyst


More from Flavio Tosti
Share:

Editor's Picks

EUR/USD holds above 1.1750 after mixed EU PMI data

EUR/USD manages to hold above 1.1750 but struggles to gather recovery momentum on Friday, following the mixed February PMI figures from Germany and the Eurozone. In the second half of the day, Q4 GDP, December inflation and February PMI data from the US will be watched closely by market participants.

GBP/USD recovers further toward 1.3500 after UK PMI data

GBP/USD is recovering ground further toward 1.3500 in European trading on Friday, helped by a modest uptick in the Pound Sterling after stronger-than-expected UK January Retail Sales and February PMI data. However, the pair's further upside could be limited amid persistent US Dollar strength as the focus turns to key US data. 

Gold sticks to positive bias above $5,000 ahead of US data

Gold gains some positive traction for the third consecutive day on Friday. holding above $5,000. Traders now look forward to the key US macro releases – the Advance Q4 GDP report and the Personal Consumption Expenditures (PCE) Price Index – for fresh trading impetus. 

US GDP growth expected to slow down significantly in Q4 after stellar Q3 

The United States Bureau of Economic Analysis will publish the first preliminary estimate of the fourth-quarter Gross Domestic Product at 13:30 GMT. Analysts forecast the US economy to have expanded at a 3% annualized rate, slowing down from the 4.4% growth posted in the previous quarter.

Iran tensions and AI fears at the forefront ahead of key US data

Thursday’s scorecard shows major US Stock benchmarks closed modestly in the red amid mounting US-Iran tensions and AI disruption worries. The S&P 500 shed 19 points (0.3%) to 6,861, the Nasdaq 100 lost 101 points (0.4%) to 24,797, and the Dow Jones Industrial Average dropped 267 points (0.5%) to 49,395.

Official Trump price approaches breakout with mixed signals from traders

Official Trump (TRUMP) is trading at $3.50 at the time of writing, approaching its upper consolidation range. A breakout from this range could open the door for an upside move. On-chain data shows market indecision, with balanced flows between bulls and bears, signaling a lack of clear directional bias.