GBP/USD technical analysis: About to confirm rising wedge on H1
- RSI, MACD indicate GBP/USD buyers’ exhaustion.
- A breakdown below support-line will confirm bearish formation.
- Seller may look for 100-HMA, 1-week old rising trend-line on fresh downpour.
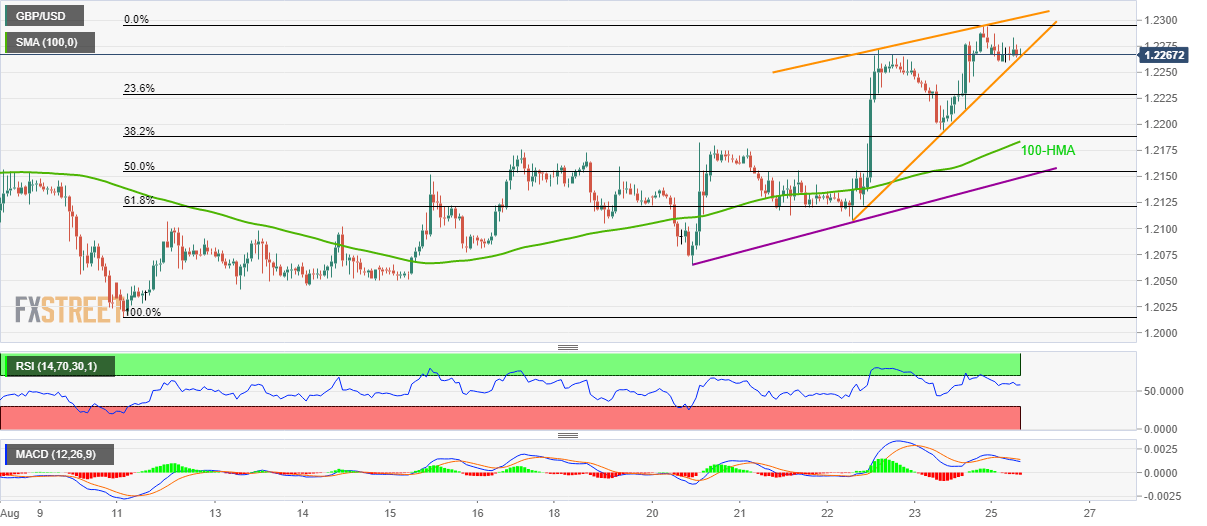
Considering the pair’s moves since Thursday, GBP/USD forms a rising wedge technical pattern on the hourly (H1) chart as it trades near 1.2270 while heading into the UK open on Monday.
Not only the price pattern lower highs but 14-bar relative strength index (RSI) and 12-bar moving average convergence and divergence (MACD) also indicate buyers’ exhaustion.
As a result, sellers await entry as soon the quote slips below 1.2260 while targeting 1.2184/83 horizontal-line including 100-hour moving average (HMA) and August 20 high during further declines.
In a case where bears dominate below 1.2183, short-term rising trend-line near 1.2150 may gain market attention.
On the contrary, 1.2295 and formation resistance of 1.2305 could limit the pair’s immediate advances, a break of which might escalate the run-up towards July 17 low close to 1.2380.
GBP/USD hourly chart
Trend: Pullback expected
Author

Anil Panchal
FXStreet
Anil Panchal has nearly 15 years of experience in tracking financial markets. With a keen interest in macroeconomics, Anil aptly tracks global news/updates and stays well-informed about the global financial moves and their implications.


