GBP/USD slips as UK CPI eases and FOMC minutes loom
- Soft UK inflation and labor data fuel Bank of England rate cut bets ahead of Fed minutes
- UK Consumer Price Index (CPI) eased to 3% year-on-year in January from 3.4%, matching consensus, while core CPI slipped to 3.1%, its lowest since August 2021.
- Federal Open Market Committee (FOMC) minutes from the January meeting and a speech from Fed Governor Bowman are due later Wednesday, with markets pricing a 90% chance the Fed holds in March.

UK inflation data released Wednesday confirmed the disinflationary trend the Bank of England (BoE) has been watching for, with headline CPI dropping to 3% and the Retail Price Index falling to 3.8% from 4.2%. The data follows Tuesday's weak labor report that showed unemployment climbing to 5.2% and payrolls falling by 30K, reinforcing expectations for further BoE rate cuts from the current 3.75%. On the US side, the Fed held rates at 3.50% to 3.75% at its January meeting in a 10-2 vote, with two dissenters pushing for a cut. Today's FOMC minutes should offer more detail on the committee's tolerance for easing, while a batch of US housing and durable goods data rounds out a busy session.
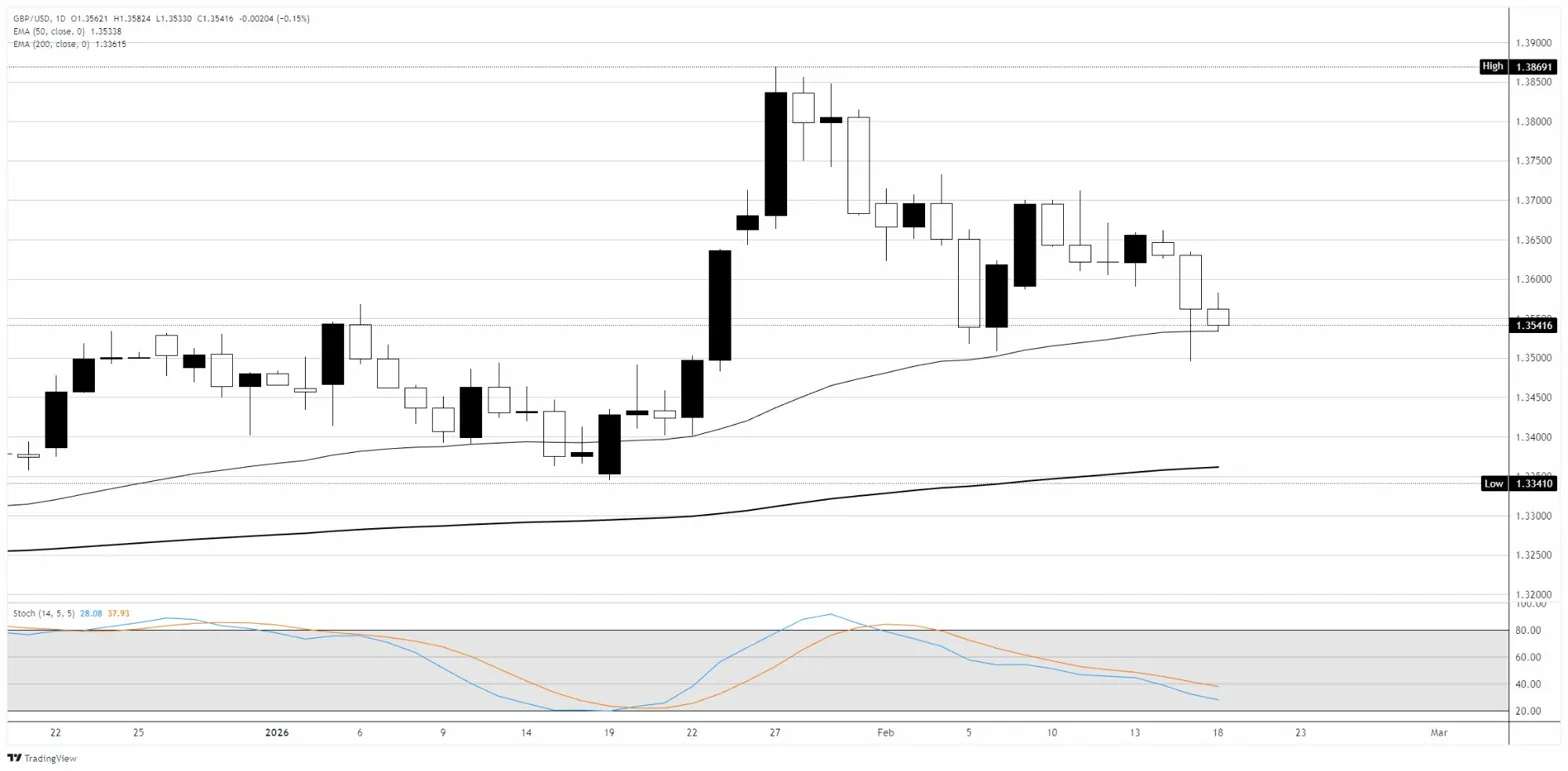
Pullback tests 50-day EMA near 1.3534 as Stochastic turns lower from mid-range
On the daily chart, GBP/USD drifted lower on Wednesday, settling near 1.3540 in a quiet session with roughly a 50-pip range. The pair is now testing the rising 50-day Exponential Moving Average (EMA) at 1.3534 for the first time since mid-January, while the 200-day EMA at 1.3362 continues to trend higher well below. Since printing the year-to-date high at 1.3869 in late January, the pair has carved a series of lower highs, with the decline accelerating after losing the 1.3600 handle this week. The Stochastic Oscillator has crossed bearish and is pressing toward the oversold zone, suggesting downside momentum is building but nearing a level where buyers may re-emerge. A daily close below the 50-day EMA would open a move toward the 1.3400 psychological level, while a bounce and reclaim of 1.3600 would be needed to stabilize a corrective move into the bullish side.
GBP/USD daily chart
Pound Sterling FAQs
The Pound Sterling (GBP) is the oldest currency in the world (886 AD) and the official currency of the United Kingdom. It is the fourth most traded unit for foreign exchange (FX) in the world, accounting for 12% of all transactions, averaging $630 billion a day, according to 2022 data. Its key trading pairs are GBP/USD, also known as ‘Cable’, which accounts for 11% of FX, GBP/JPY, or the ‘Dragon’ as it is known by traders (3%), and EUR/GBP (2%). The Pound Sterling is issued by the Bank of England (BoE).
The single most important factor influencing the value of the Pound Sterling is monetary policy decided by the Bank of England. The BoE bases its decisions on whether it has achieved its primary goal of “price stability” – a steady inflation rate of around 2%. Its primary tool for achieving this is the adjustment of interest rates. When inflation is too high, the BoE will try to rein it in by raising interest rates, making it more expensive for people and businesses to access credit. This is generally positive for GBP, as higher interest rates make the UK a more attractive place for global investors to park their money. When inflation falls too low it is a sign economic growth is slowing. In this scenario, the BoE will consider lowering interest rates to cheapen credit so businesses will borrow more to invest in growth-generating projects.
Data releases gauge the health of the economy and can impact the value of the Pound Sterling. Indicators such as GDP, Manufacturing and Services PMIs, and employment can all influence the direction of the GBP. A strong economy is good for Sterling. Not only does it attract more foreign investment but it may encourage the BoE to put up interest rates, which will directly strengthen GBP. Otherwise, if economic data is weak, the Pound Sterling is likely to fall.
Another significant data release for the Pound Sterling is the Trade Balance. This indicator measures the difference between what a country earns from its exports and what it spends on imports over a given period. If a country produces highly sought-after exports, its currency will benefit purely from the extra demand created from foreign buyers seeking to purchase these goods. Therefore, a positive net Trade Balance strengthens a currency and vice versa for a negative balance.
Author

Joshua Gibson
FXStreet
Joshua joins the FXStreet team as an Economics and Finance double major from Vancouver Island University with twelve years' experience as an independent trader focusing on technical analysis.


