GBP/USD slips as Trump’s tariffs roil FX markets, CPI data looms
- GBP/USD falls as Trump slaps 30% tariffs on EU and Mexico, spurring mixed market reaction.
- US inflation is expected to rise 2.7% YoY, signaling the tariffs’ consumer impact.
- UK GDP slowdown boosts BoE rate cut bets ahead of CPI release.

The Pound Sterling (GBP) retreats by 0.18% during the North American session as the US Dollar (USD) recovers following US President Donald Trump's wave of tariffs that included the European Union (EU) and Mexico. Although initially triggering a risk-off reaction, sentiment shifted positively in equities but not in the FX space. GBP/USD trades at 1.3453 at the time of writing.
Cable dips on trade tensions mount and inflation risks cloud Fed and BoE rate paths
Over the weekend, US President Donald Trump announced 30% tariffs on imports from the European Union and Mexico, with the latter being less harmed than Canada’s 35% duties imposed last Thursday.
In the meantime, the current week opened with a deteriorated mood. However, traders seem confident that three of the largest partners of the US –Canada, the EU, and Mexico–would sign deals ahead of the fixed August 1 deadline.
On the data front, the release of inflation figures would be the focus on Tuesday. The Consumer Price Index (CPI) is expected to rise from 2.4% to 2.7% YoY in June. Excluding volatile items like food and energy for the same period, would hit the 3% YoY threshold, up from 2.8% in a major sign that tariffs impact is being felt by consumers.
This would exert pressure on the Federal Reserve, which so far has witnessed a sudden change of views about the current monetary policy. Governors Waller and Bowman, and San Francisco Fed President Mary Daly leaned to the dovish side, expecting at least two rate cuts in 2025.
In the UK, the Gross Domestic Product (GDP) print showed the economy is slowing, hence increasing the chances for further rate cuts by the Bank of England (BoE). Still, traders need to digest the release of CPI figures in the UK. Any sign of weakness would be the green light for GBP/USD sellers to drive price action lower, after the pair hit a yearly peak of 1.3788 on July 1.
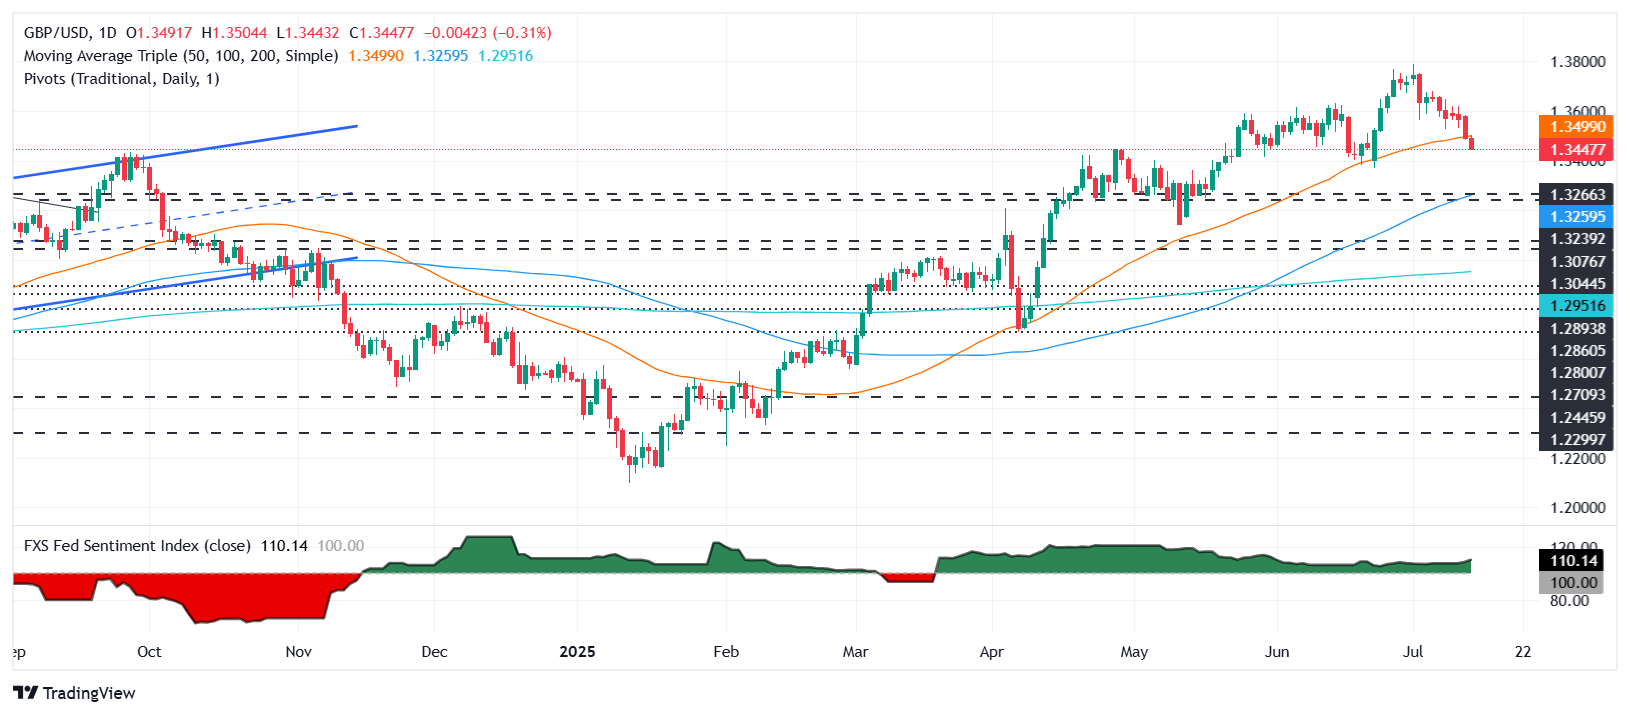
GBP/USD Price Forecast: Technical outlook
The GBP/USD pair tumbles below the 1.3500 figure and the 50-day SMA at 1.3495, sponsoring the current leg down, toward 1.3450 and below. Momentum has turned bearish on the daily chart, as depicted by the Relative Strength Index (RSI), but price action indicates that bulls’ last line of defense would be the June 23 low of 1.3369. On the flipside, a recovery above 1.3500 paves the path to challenge the 20-day SA at 1.3583.
British Pound PRICE This month
The table below shows the percentage change of British Pound (GBP) against listed major currencies this month. British Pound was the strongest against the Japanese Yen.
| USD | EUR | GBP | JPY | CAD | AUD | NZD | CHF | |
|---|---|---|---|---|---|---|---|---|
| USD | 0.89% | 2.12% | 2.40% | 0.58% | 0.28% | 1.86% | 0.51% | |
| EUR | -0.89% | 1.23% | 1.41% | -0.31% | -0.50% | 0.95% | -0.36% | |
| GBP | -2.12% | -1.23% | 0.28% | -1.49% | -1.71% | -0.27% | -1.56% | |
| JPY | -2.40% | -1.41% | -0.28% | -1.74% | -2.07% | -0.55% | -1.83% | |
| CAD | -0.58% | 0.31% | 1.49% | 1.74% | -0.31% | 1.24% | -0.08% | |
| AUD | -0.28% | 0.50% | 1.71% | 2.07% | 0.31% | 1.46% | 0.15% | |
| NZD | -1.86% | -0.95% | 0.27% | 0.55% | -1.24% | -1.46% | -1.30% | |
| CHF | -0.51% | 0.36% | 1.56% | 1.83% | 0.08% | -0.15% | 1.30% |
The heat map shows percentage changes of major currencies against each other. The base currency is picked from the left column, while the quote currency is picked from the top row. For example, if you pick the British Pound from the left column and move along the horizontal line to the US Dollar, the percentage change displayed in the box will represent GBP (base)/USD (quote).
Author

Christian Borjon Valencia
FXStreet
Markets analyst, news editor, and trading instructor with over 14 years of experience across FX, commodities, US equity indices, and global macro markets.


