GBP/USD sheds weight for a fourth straight day on Wednesday
- GBP/USD tested below the 1.2700 handle on Wednesday, easing back further.
- Cable shed another third of a percent and sold off for a fourth straight day.
- US PPI inflation, UK GRDP growth update loom ahead.

GBP/USD eased further into the low end on Wednesday, trimming further south of the 200-day Exponential Moving Average (EMA) in a one-sided bearish decline as the pair closes in the red for a fourth consecutive trading day. The Pound Sterling shed extra weight against the broadly-recovering Greenback, sparked by a US Consumer Price Index (CPI) inflation print that didn’t deliver markets the easing inflation hint they were hoping for, but still came in at forecasts.
Coming up on Thursday will be a fresh print of US Producer Price Index (PPI) business level inflation, which is forecast to accelerate in October to 3.0% from 2.8% YoY. On the UK side, Cable traders will be settling in for a wait to Thursday’s UK Gross Domestic Product (GDP) print for the third quarter, which is forecast to slump to a scant 0.2% QoQ from the previous 0.5%.
US Consumer Price Index (CPI) inflation figures came in stickier than many had hoped, but still well within median market forecasts, helping to keep investor sentiment elevated. Headline CPI held steady at 0.2% MoM as expected, while annualized headline CPI inflation accelerated to 2.6% YoY from the previous 2.4%, as markets predicted. Core CPI inflation also met market expectations, holding at 0.3% MoM and 3.3% on an annualized basis.
GBP/USD price forecast
The GBP/USD daily chart shows a pronounced bearish momentum, with the price decisively breaking below the 200-day EMA (black line) around 1.2867, a significant support level that had held since early November. This breakdown below the 200-day EMA indicates a shift toward a medium-term bearish outlook, as the currency pair struggles to hold above this key long-term moving average. Moreover, the 50-day EMA (blue line) remains below the price level, reinforcing the downward bias and suggesting that selling pressure is likely to persist as long as the price trades beneath these critical EMAs.
The MACD indicator at the bottom of the chart reflects intensifying bearish momentum, with the MACD line diverging further below the signal line in negative territory. This bearish crossover, accompanied by declining histogram bars, underscores the weakness in GBP/USD and hints at a potential extension of the downtrend. The lack of any bullish divergence on the MACD suggests that buying interest is limited, and without a substantial catalyst, the pair may struggle to regain positive momentum. Traders might look to the MACD and any potential decrease in selling pressure as initial signs of a trend reversal, though such signals are currently lacking.
The next support level to watch lies around the psychological handle of 1.2700, which is close to the current price level. A break below this area could expose GBP/USD to further downside risks, potentially targeting the 1.2600 mark as the next support level. On the flip side, if the pair manages to recover and reclaim the 200-day EMA, it could signal a shift in sentiment; however, this would require substantial buying pressure, likely tied to positive economic data from the UK or a broad weakening in the US dollar. Until such developments occur, the technical setup favors the bears, with further downside likely if GBP/USD fails to stabilize above the immediate support.
GBP/USD daily chart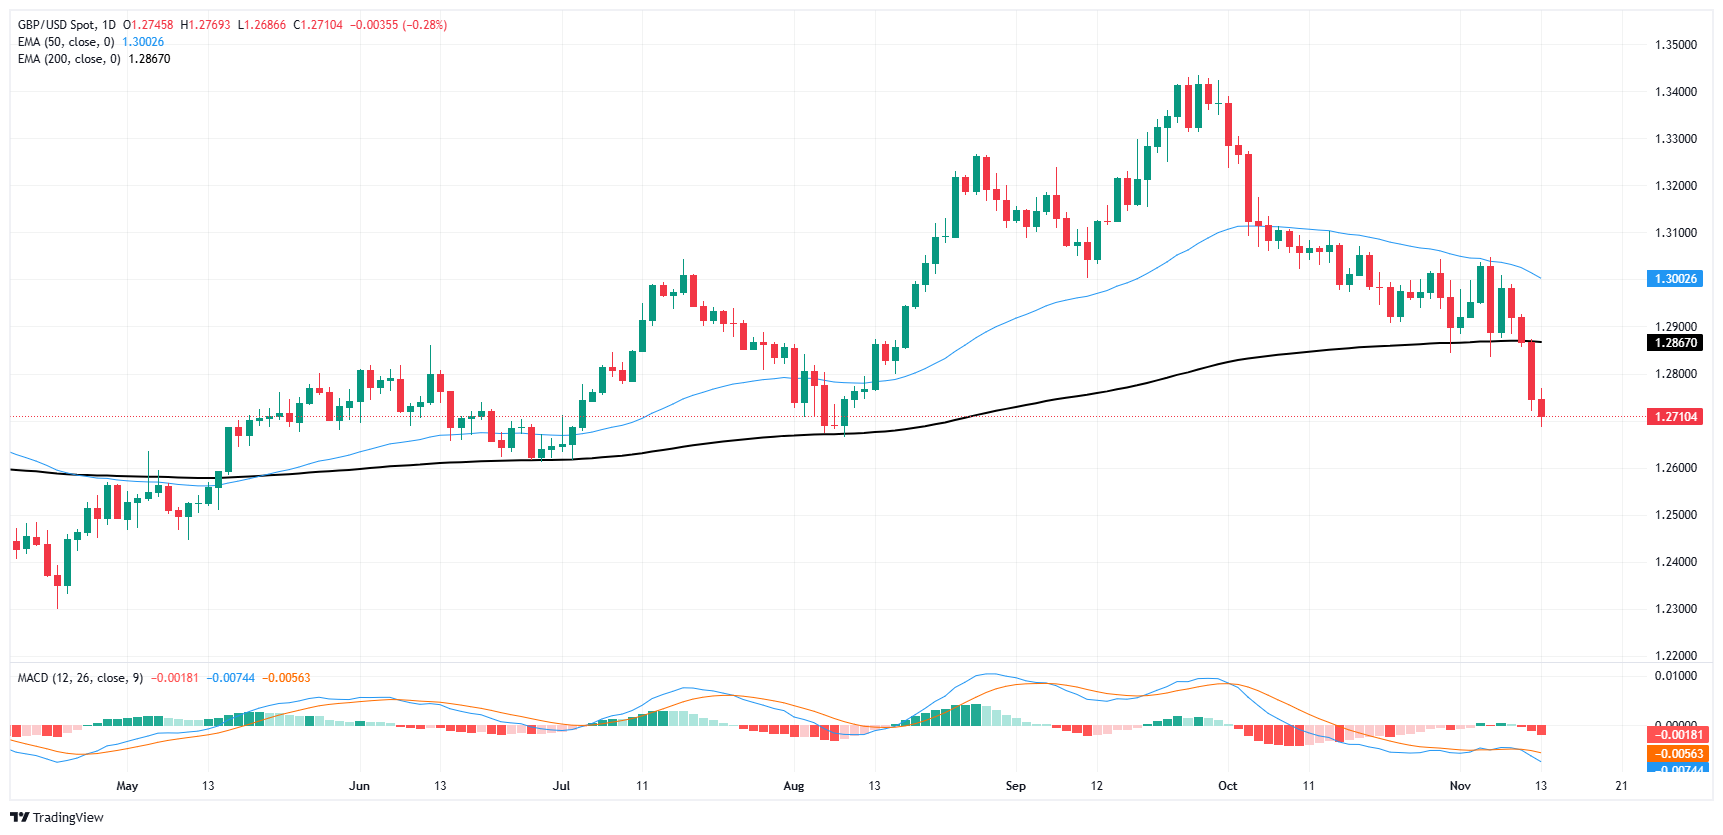
Pound Sterling FAQs
The Pound Sterling (GBP) is the oldest currency in the world (886 AD) and the official currency of the United Kingdom. It is the fourth most traded unit for foreign exchange (FX) in the world, accounting for 12% of all transactions, averaging $630 billion a day, according to 2022 data. Its key trading pairs are GBP/USD, also known as ‘Cable’, which accounts for 11% of FX, GBP/JPY, or the ‘Dragon’ as it is known by traders (3%), and EUR/GBP (2%). The Pound Sterling is issued by the Bank of England (BoE).
The single most important factor influencing the value of the Pound Sterling is monetary policy decided by the Bank of England. The BoE bases its decisions on whether it has achieved its primary goal of “price stability” – a steady inflation rate of around 2%. Its primary tool for achieving this is the adjustment of interest rates. When inflation is too high, the BoE will try to rein it in by raising interest rates, making it more expensive for people and businesses to access credit. This is generally positive for GBP, as higher interest rates make the UK a more attractive place for global investors to park their money. When inflation falls too low it is a sign economic growth is slowing. In this scenario, the BoE will consider lowering interest rates to cheapen credit so businesses will borrow more to invest in growth-generating projects.
Data releases gauge the health of the economy and can impact the value of the Pound Sterling. Indicators such as GDP, Manufacturing and Services PMIs, and employment can all influence the direction of the GBP. A strong economy is good for Sterling. Not only does it attract more foreign investment but it may encourage the BoE to put up interest rates, which will directly strengthen GBP. Otherwise, if economic data is weak, the Pound Sterling is likely to fall.
Another significant data release for the Pound Sterling is the Trade Balance. This indicator measures the difference between what a country earns from its exports and what it spends on imports over a given period. If a country produces highly sought-after exports, its currency will benefit purely from the extra demand created from foreign buyers seeking to purchase these goods. Therefore, a positive net Trade Balance strengthens a currency and vice versa for a negative balance.
Author

Joshua Gibson
FXStreet
Joshua joins the FXStreet team as an Economics and Finance double major from Vancouver Island University with twelve years' experience as an independent trader focusing on technical analysis.


