GBP/USD retreats below 1.3100 amid underwhelming US data, looming UK inflation report
- GBP/USD slides 0.13%, pulled down by disappointing US retail sales and industrial production data, alongside the uncertain US economic outlook.
- UK’s upcoming Consumer Price Index release could pressure Bank of England’s monetary policy direction.
- ING analysts predict GBP/USD’s potential rise towards 1.33 in the near term, conditional on inflationary figures and BoE’s response.

GBP/USD struggles at 1.3100 and retreats as the United States (US) economy continued to show signs of weakening, suggested by not-so-good economic data revealed on early Tuesday. In addition, the United Kingdom (UK) inflation report, just around the corner, is set to keep the GBP/USD pair within familiar levels. At the time of writing, the GBP/USD is trading at 1.3055, down 0.13%.
Uneasy equilibrium keeps the GBP/USD pair within familiar ranges as the market awaits UK’s June CPI
The latest data on US retail sales for June showed a modest increase of 0.2% compared to the previous month, falling short of the estimated growth of 0.5%. When excluding automobile sales, often referred to as core retail sales, the figures also missed forecasts, with a modest 0.2% month-on-month increase compared to the anticipated 0.3%. In addition, the US Federal Reserve released data on industrial production, which experienced a significant decline. Monthly figures showed a slide of -0.5% compared to the previous month, below the expected 0% growth. On an annual basis, market participants had projected a 1.1% expansion, but the data revealed a decline of -0.4% for June.
Across the pond, the UK’s economic docket will feature the release of the Consumer Price Index (CPI) for June. Market participants estimate CPI would fall to 8.2% YoY, below May’s 8.7%. Core CPI is projected to stay steady at 7.1% YoY. If inflation exceeds estimates, that could pave the way for further tightening by the Bank of England (BoE). Otherwise, it could ease pressure on the BoE, which remains under stress, as it has failed to provide price stability after the Covid-19 pandemic.
Initially, the US Dollar weakened on the release. As of late, it’s recovering lost ground as depicted by the US Dollar Index, which tracks the performance of six currencies vs. the US Dollar, which stands at 99.952 and gains 0.07%.
Despite that, ING analysts estimate the GBP/USD could aime towards 1.33 in the near term. Nevertheless, they noted that “a soft inflation print could hurt” the Sterling (GBP) prospects and stir a drop in the GBP/USD. Regarding monetary policy, they wrote, “At the moment, we look for two more BoE rate hikes – policy rate to 5.50% – but well below the 6%+ rates priced by the markets.”
GBP/USD Price Analysis: Technical outlook
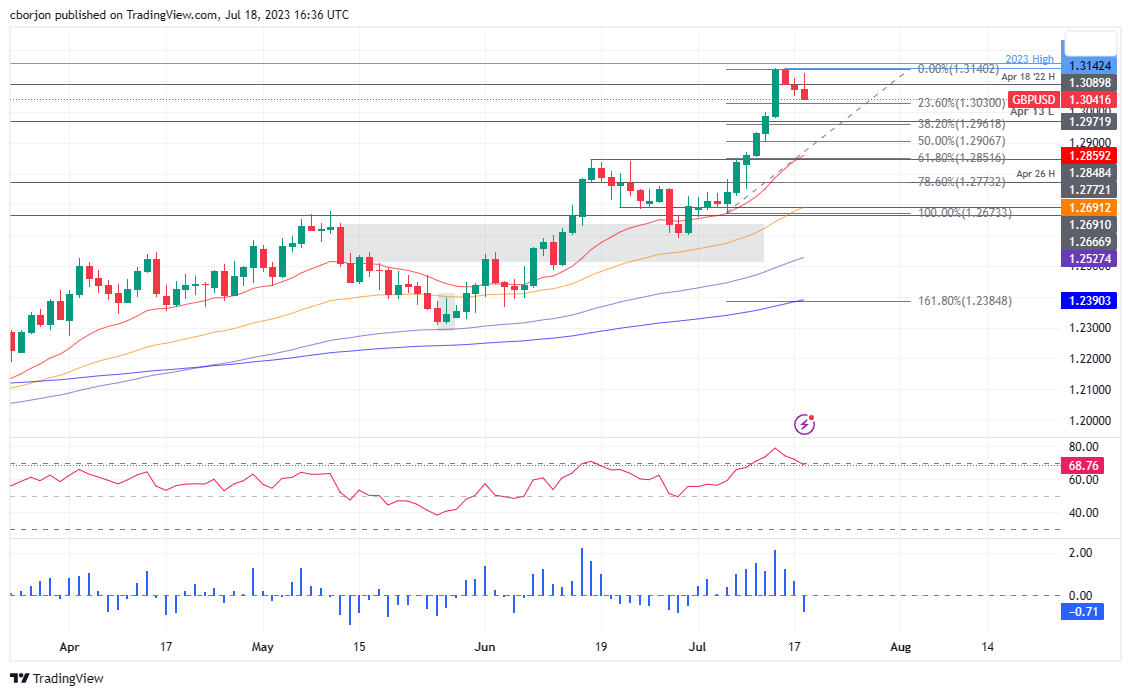
The GBP/USD daily chart portrays the pair as upward biased but on an ongoing correction after hitting a year-to-date (YTD) high of 1.3142, in addition to the Relative Strength Index (RSI) indicator exiting from overbought territory. That, alongside the three-day Rate of Change (RoC) depicting sellers gathering momentum, opens the door for the pullback. The GBP/USD first support would be the 38.2% Fibonacci (Fibo) retracement at 1.2962. A breach of the latter will expose the 50% Fibo retracement at 1.2906, followed by the confluence of the June 16 high and the 61.8% Fibo at around 1.2848/51. Contrarily, the GBPUSD fist resistance would be 1.3100, followed by the YTD high at 1.3142.
Author

Christian Borjon Valencia
FXStreet
Markets analyst, news editor, and trading instructor with over 14 years of experience across FX, commodities, US equity indices, and global macro markets.
















