GBP/USD rallies past 1.2600 as weak US Retail Sales sink the USD
- US Retail Sales plunge 0.9% in January, missing forecasts.
- UK GDP surprises to the upside, boosting Pound momentum.
- GBP/USD eyes 100-day SMA at 1.2694 despite Fed-BoE policy divergence.
The Pound Sterling (GBP) rallied for the fourth consecutive day on Friday, reclaiming the 1.2600 figure following a dismal United States (US) Retail Sales report that reflected American consumers cut their expenses. The GBP/USD pair trades at 1.2626, up over 0.50%.
Sterling climbs past 1.2600 as UK data outperforms expectations
The financial markets narrative revolved around US President Donald Trump's tariffs, with the Greenback treading water. US Retail Sales data disappointed investors after contracting over -0.9% MoM in January, missing estimates of -0.1% and December figures upwardly revised by 0.7%.
Other data revealed that Industrial Production expanded in January, over 0.5% MoM down from December’s 1% but exceeded economists’ projections of 0.3%
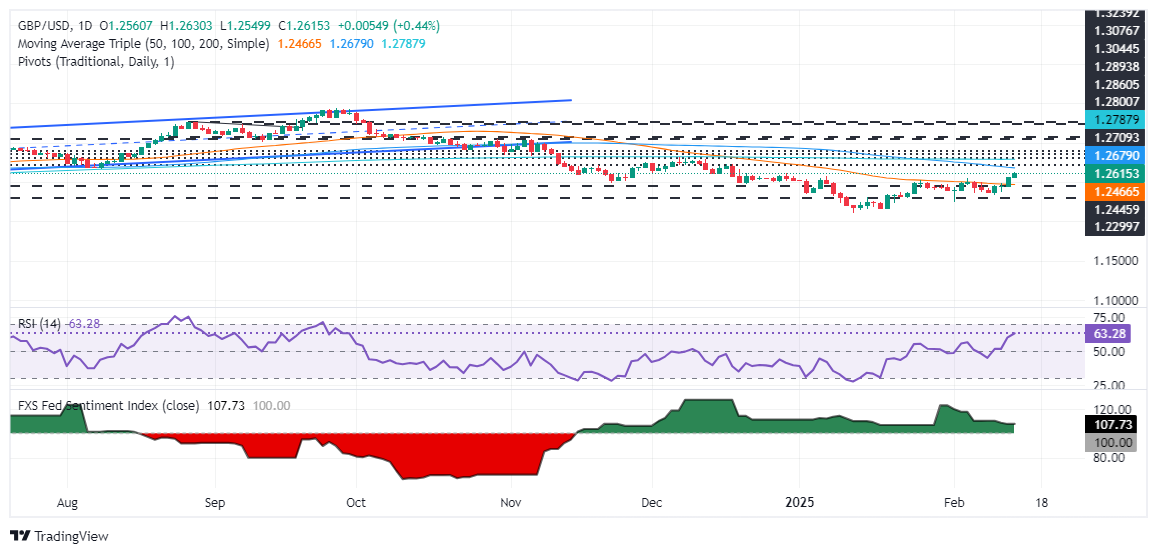
Today’s data and better-than-expected Gross Domestic Product (GDP) figures in the UK keep the GBP/USD pair tilted to the upside. Buyers are eyeing a test of the 100-day Simple Moving Average (SMA) at 1.2694.
This is despite the divergence in monetary policy between the Federal Reserve (Fed) and the Bank of England (BoE). The former is expected to keep policy in check, with 35 basis points of easing priced in by traders for the year’s end. Meanwhile, the BoE reduced borrowing costs last week, with two members voting for a 50-basis point cut.
Next week, the economic docket in the UK will feature BoE’s Governor Bailey speech, jobs data, the latest inflation report, and Retail Sales. On the US, the Fed parade will continue with the release of the latest FOMC meeting minutes, housing data, and S&P Flash PMIs.
GBP/USD Price Forecast: Technical outlook
GBP/USD shifted neutral after witnessing a fall of close to 10% since September 26, 2024. However, buyers stepped in and pushed the pair above the 50-day Simple Moving Average (SMA) of 1.2472, taking advantage of a weaker US Dollar.
The Relative Strength Index (RSI) reveals that momentum shifted in favor of buyers; henceforth, further upside is seen. If GBP/USD climbs past the 100-day SMA, the next resistance would be 1.2700, followed by the 200-day SMA at 1.2786.
Conversely, if GBP/USD drops below the February 5 daily high at 1.2549, the next support would be the 50-day SMA at 1.2472.
British Pound PRICE Today
The table below shows the percentage change of British Pound (GBP) against listed major currencies today. British Pound was the strongest against the US Dollar.
| USD | EUR | GBP | JPY | CAD | AUD | NZD | CHF | |
|---|---|---|---|---|---|---|---|---|
| USD | -0.40% | -0.45% | -0.40% | -0.18% | -0.66% | -0.93% | -0.55% | |
| EUR | 0.40% | -0.05% | 0.00% | 0.22% | -0.26% | -0.54% | -0.14% | |
| GBP | 0.45% | 0.05% | 0.08% | 0.27% | -0.20% | -0.48% | -0.10% | |
| JPY | 0.40% | 0.00% | -0.08% | 0.20% | -0.28% | -0.56% | -0.18% | |
| CAD | 0.18% | -0.22% | -0.27% | -0.20% | -0.50% | -0.75% | -0.38% | |
| AUD | 0.66% | 0.26% | 0.20% | 0.28% | 0.50% | -0.29% | 0.10% | |
| NZD | 0.93% | 0.54% | 0.48% | 0.56% | 0.75% | 0.29% | 0.38% | |
| CHF | 0.55% | 0.14% | 0.10% | 0.18% | 0.38% | -0.10% | -0.38% |
The heat map shows percentage changes of major currencies against each other. The base currency is picked from the left column, while the quote currency is picked from the top row. For example, if you pick the British Pound from the left column and move along the horizontal line to the US Dollar, the percentage change displayed in the box will represent GBP (base)/USD (quote).
Author

Christian Borjon Valencia
FXStreet
Markets analyst, news editor, and trading instructor with over 14 years of experience across FX, commodities, US equity indices, and global macro markets.


