GBP/USD Price Forecast: Tumbles below 1.3200 as US Dollar recovers
- GBP/USD momentum favors sellers, possibly targeting the July 17 high of 1.3043.
- Further declines could test 1.3043; next major support at March 8 high of 1.2893.
- For an upside reversal, buyers need to breach 1.3200, aiming for two-year high at 1.3266, then 1.3293 and 1.3437.

The GBP/USD extended its losses to two straight days and cleared the 1.3200 figure on the downside, as bears woke up after August’s 400-pip rally, crushed their expectations for lower prices. Despite the lack of UK economic data, the docket remains busy across the pond, with goodish data bolstering the Greenback. Therefore, the pair trades at 1.3151, down 0.30%.
GBP/USD Price Forecast: Technical outlook
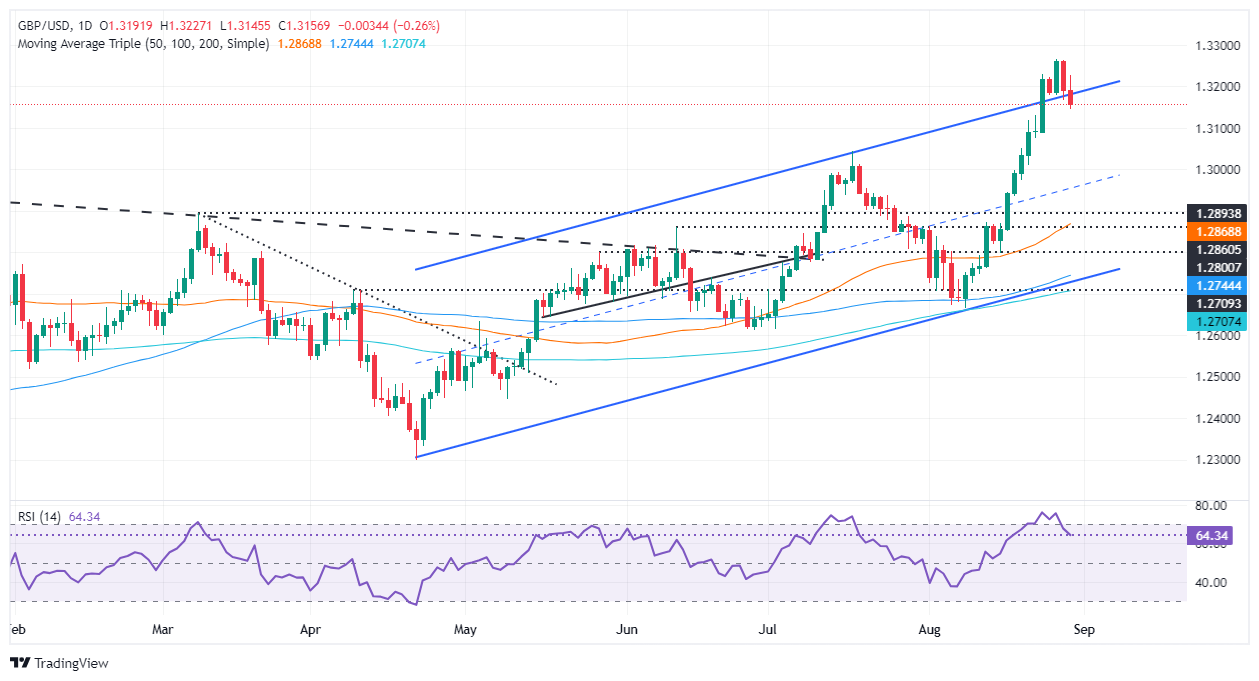
The GBP/USD daily chart hints that in the short-term, the pair could aim and test the latest cycle high witnessed on July 17, at 1.3043. Momentum has shifted in sellers' favor as the Relative Strength Index (RSI) peaked at overbought territory. However, it has finally retraced below the 70 level, spurring the major’s two-day pullback to current exchange rates.
Although sellers are in charge, they must clear the 1.3100 figure and the psychological 1.3050 support before testing lower waters. If those two levels are taken out, the GBP/USD could aim for 1.3043, and on further weakness, the March 8 daily high emerges as the next demand zone at 1.2893.
On the other hand, if buyers want to counterattack, they must breach the 1.3200 figure. This will immediately expose the two-year high at 1.3266. A breach of the latter, and buyers could challenge the March 23, 2022, daily high at 1.3293 ahead of the March 1, 2022, swing high at 1.3437.
GBP/USD Price Action – Daily Chart
British Pound PRICE Today
The table below shows the percentage change of British Pound (GBP) against listed major currencies today. British Pound was the strongest against the Swiss Franc.
| USD | EUR | GBP | JPY | CAD | AUD | NZD | CHF | |
|---|---|---|---|---|---|---|---|---|
| USD | 0.44% | 0.25% | 0.54% | -0.02% | -0.13% | -0.21% | 0.75% | |
| EUR | -0.44% | -0.19% | 0.11% | -0.48% | -0.58% | -0.65% | 0.31% | |
| GBP | -0.25% | 0.19% | 0.31% | -0.28% | -0.39% | -0.46% | 0.53% | |
| JPY | -0.54% | -0.11% | -0.31% | -0.56% | -0.68% | -0.78% | 0.23% | |
| CAD | 0.02% | 0.48% | 0.28% | 0.56% | -0.10% | -0.18% | 0.82% | |
| AUD | 0.13% | 0.58% | 0.39% | 0.68% | 0.10% | -0.05% | 0.95% | |
| NZD | 0.21% | 0.65% | 0.46% | 0.78% | 0.18% | 0.05% | 0.99% | |
| CHF | -0.75% | -0.31% | -0.53% | -0.23% | -0.82% | -0.95% | -0.99% |
The heat map shows percentage changes of major currencies against each other. The base currency is picked from the left column, while the quote currency is picked from the top row. For example, if you pick the British Pound from the left column and move along the horizontal line to the US Dollar, the percentage change displayed in the box will represent GBP (base)/USD (quote).
Author

Christian Borjon Valencia
FXStreet
Markets analyst, news editor, and trading instructor with over 14 years of experience across FX, commodities, US equity indices, and global macro markets.


