GBP/USD Price Forecast: Sellers dominate but a Doji candle hints at indecision
- GBP/USD breaks channel support but a Doji candle on the daily chart reflects a temporary pause in the trend.
- Momentum indicators signal potential for a deeper correction as volatility tightens and bulls struggle to regain control.
- GBP/USD weekly chart hints at cracks in the medium-term outlook.

GBP/USD is at a technical inflection point, a battleground between weakening bullish momentum and growing bearish pressure. Thursday’s Doji candle on the daily chart, reflects a temporary pause, with the lack of a body signaling that buyers stepped in to defend the 1.3390–1.3370 region, despite early downside pressure.
While the candle hasn’t closed yet, this kind of price action often indicates rejection of lower levels or at least buyer interest emerging near key support. It doesn’t yet confirm a reversal, but it does raise the stakes for both sides.
GBP/USD clings to key support as sellers tighten their grip
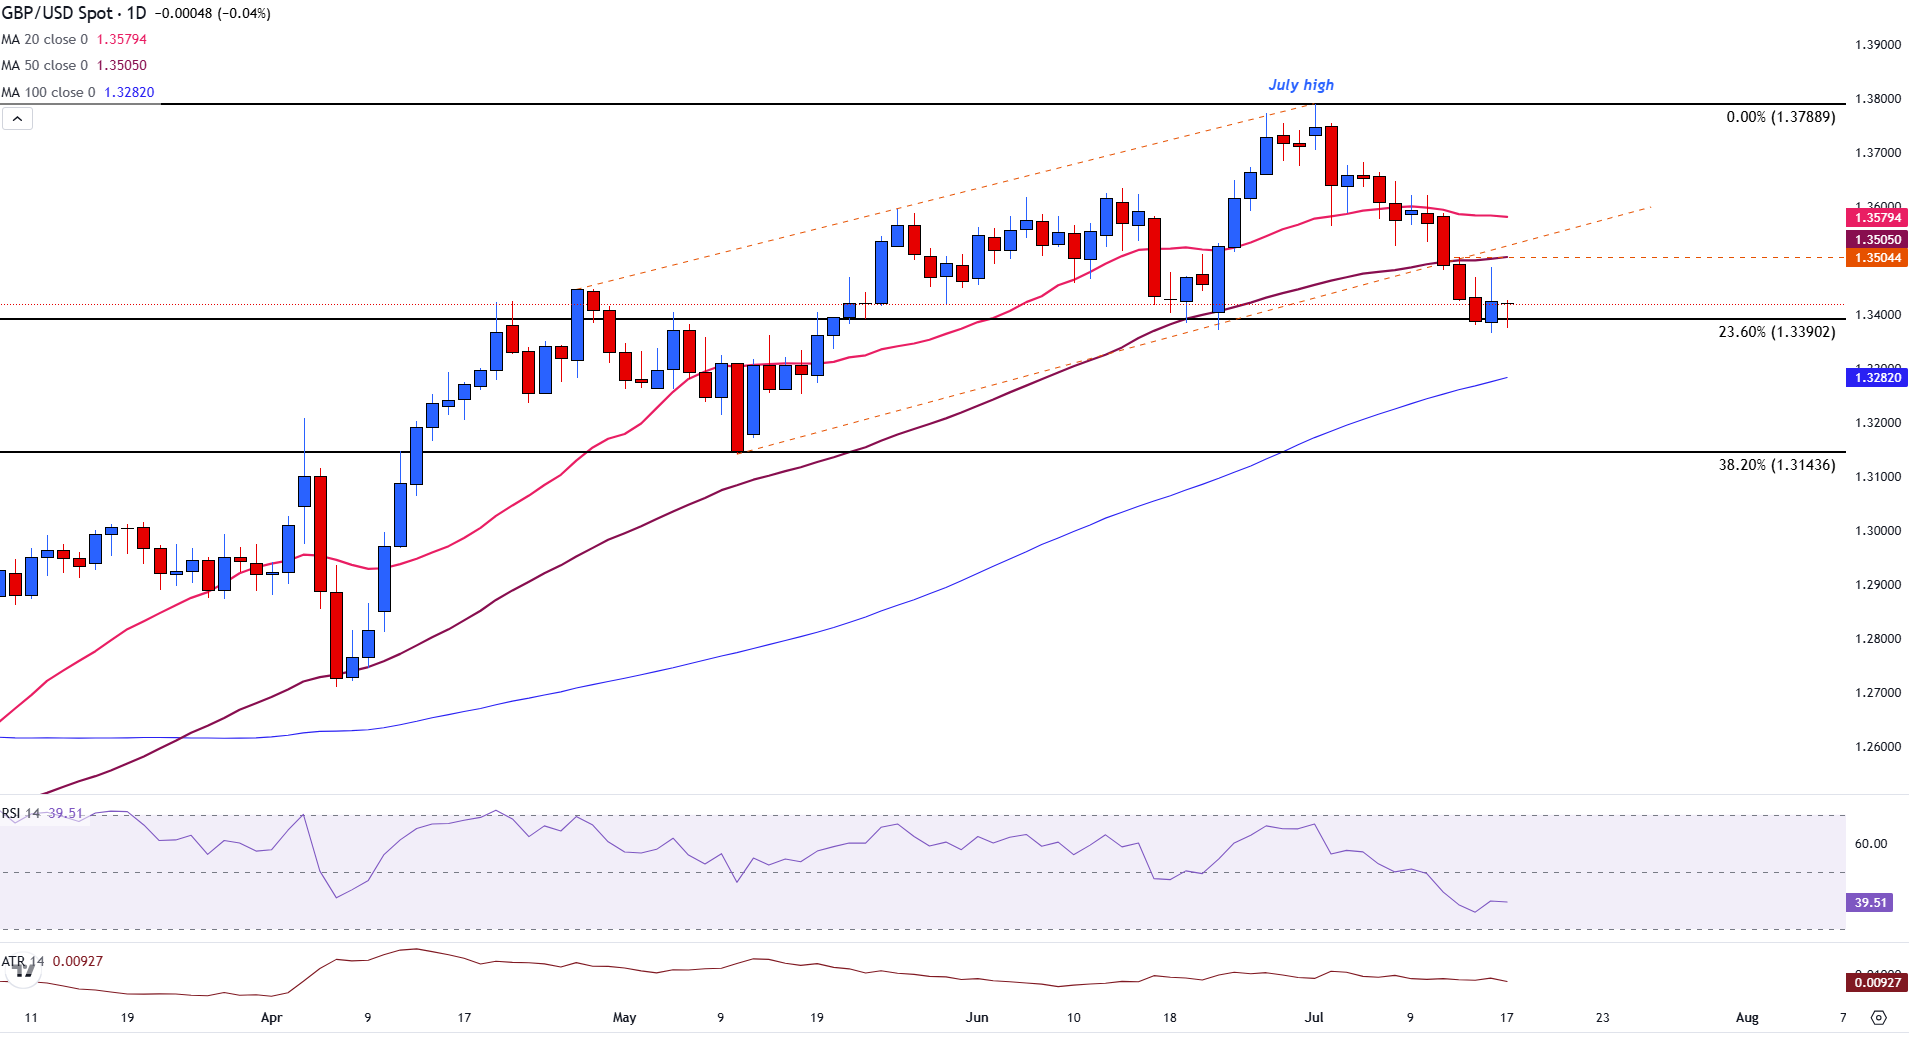
GBP/USD has broken below its rising channel and is now hovering above 1.3400 with a major support zone forming at the 23.6% Fibonacci retracement level of the January-July rally near 1.3390.
Price action remains below the 50-day Simple Moving Average (SMA) resistance level of 1.3505 and the 20-day SMA at 1.3579, signaling a notable loss of short-term bullish momentum.
The failed hold above the 1.3500 psychological level and a break below the channel structure suggest that sellers are beginning to assert control.
Momentum indicators confirm the shift. The Relative Strength Index (RSI) is currently around 39 and is shifting closer toward oversold territory but not quite there yet.
Meanwhile, the Average True Range (ATR) sits near 0.00927, showing daily volatility has compressed to about 92–93 pips. When the ATR contracts, it often precedes a breakout, so traders should watch for an increase in volatility, especially near key technical levels.
If price decisively breaks below 1.3390, the next downside targets are the 100-day SMA at 1.3281, followed by the 38.2% Fibo level at 1.3144 zone.
With the short-term trend signaling that selling pressure continues to build , bulls would need to reclaim the 50-day SMA and recover above the 1.3575 zone to shift short-term sentiment back in their favor.
GBP/USD daily chart
GBP/USD weekly chart hints at cracks in the medium-term outlook
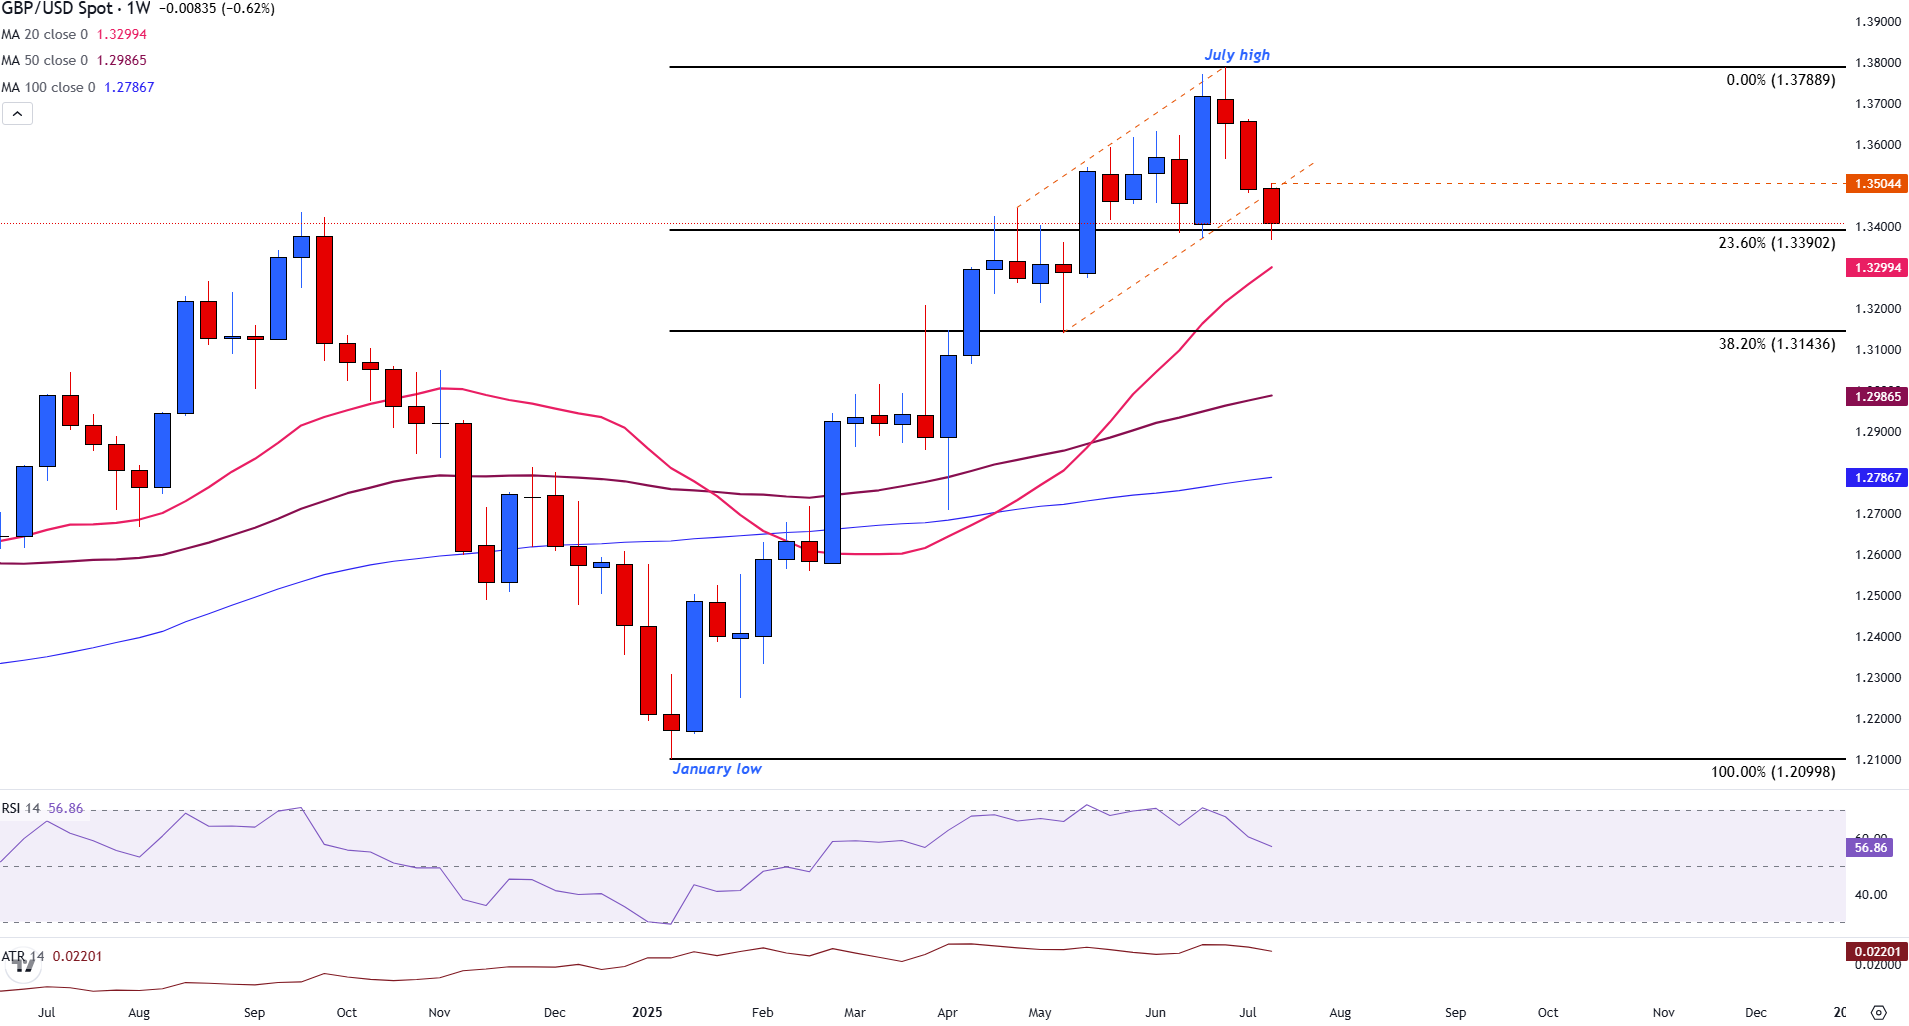
Zooming out, the GBP/USD weekly chart confirms a clear bearish shift. The sharp rejection from the July high near 1.3789, marked by a long upper wick, was the first warning sign. Last week’s full-bodied bearish candle followed through decisively, closing near the lows at channel support reflected strong, sustained selling pressure. This wasn’t just a pullback, it was a clean downside move.
The current weekly candle has a small lower wick after bears failed to break below the 23.6% Fibo level on Thursday. However, the full body of the candle is building onto last week’s downside momentum. The absence of a significant lower wick so far shows little pushback from buyers, reinforcing the idea that sellers are in clear control at this stage. This is a classic bearish continuation candle, particularly concerning given it forming right at a critical support area around 1.3390.
If this price action holds into the weekly close, it would mark a clean break below the 23.6% Fibonacci retracement and could pave the way toward deeper downside levels such as the 20-week SMA at 1.3299, followed by the 38.2% retracement at 1.3144. Momentum is clearly deteriorating, and the structure of this weekly candle makes it harder for bulls to argue for a near-term bounce, unless there’s a significant reversal before Friday’s close.
The weekly Relative Strength Index (RSI) near 57 suggests that the broader trend remains intact, but momentum is clearly weakening.
USD/GBP weekly chart
With GBP/USD holding just above critical support and volatility compressed, the pair is approaching a tipping point, and whichever side seizes control next could define the direction for weeks to come.
Pound Sterling FAQs
The Pound Sterling (GBP) is the oldest currency in the world (886 AD) and the official currency of the United Kingdom. It is the fourth most traded unit for foreign exchange (FX) in the world, accounting for 12% of all transactions, averaging $630 billion a day, according to 2022 data. Its key trading pairs are GBP/USD, also known as ‘Cable’, which accounts for 11% of FX, GBP/JPY, or the ‘Dragon’ as it is known by traders (3%), and EUR/GBP (2%). The Pound Sterling is issued by the Bank of England (BoE).
The single most important factor influencing the value of the Pound Sterling is monetary policy decided by the Bank of England. The BoE bases its decisions on whether it has achieved its primary goal of “price stability” – a steady inflation rate of around 2%. Its primary tool for achieving this is the adjustment of interest rates. When inflation is too high, the BoE will try to rein it in by raising interest rates, making it more expensive for people and businesses to access credit. This is generally positive for GBP, as higher interest rates make the UK a more attractive place for global investors to park their money. When inflation falls too low it is a sign economic growth is slowing. In this scenario, the BoE will consider lowering interest rates to cheapen credit so businesses will borrow more to invest in growth-generating projects.
Data releases gauge the health of the economy and can impact the value of the Pound Sterling. Indicators such as GDP, Manufacturing and Services PMIs, and employment can all influence the direction of the GBP. A strong economy is good for Sterling. Not only does it attract more foreign investment but it may encourage the BoE to put up interest rates, which will directly strengthen GBP. Otherwise, if economic data is weak, the Pound Sterling is likely to fall.
Another significant data release for the Pound Sterling is the Trade Balance. This indicator measures the difference between what a country earns from its exports and what it spends on imports over a given period. If a country produces highly sought-after exports, its currency will benefit purely from the extra demand created from foreign buyers seeking to purchase these goods. Therefore, a positive net Trade Balance strengthens a currency and vice versa for a negative balance.
Author

Tammy Da Costa, CFTe®
FXStreet
Tammy is an economist and market analyst with a deep passion for financial markets, particularly commodities and geopolitics.


