GBP/USD Price Forecast: Hits fresh 39-month highs near 1.3600
- GBP/USD may approach the ascending channel’s upper boundary at 1.3960.
- The 14-day Relative Strength Index (RSI) rises toward 50, strengthening a bullish bias.
- The nine-day EMA of 1.3428 would act as an initial support level.

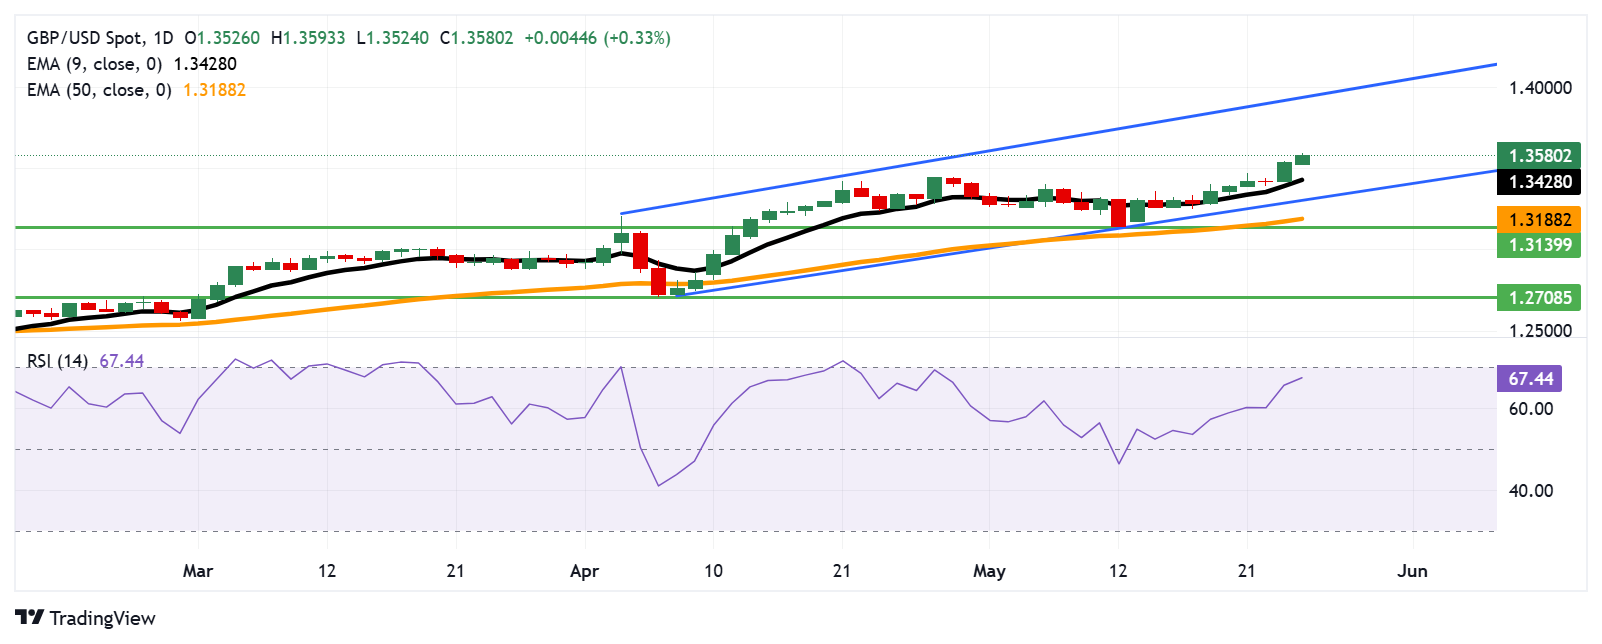
The GBP/USD pair extends its winning streak for the second successive session, trading around 1.3580 during Monday's Asian hours. The technical analysis of the daily chart suggests that a bullish bias prevails as the pair moves upwards within an ascending channel pattern.
The GBP/USD pair continues to rise above the nine-day Exponential Moving Average (EMA), suggesting the short-term price momentum is stronger. Additionally, the 14-day Relative Strength Index (RSI) rises toward 70, reinforcing a bullish bias. A break above the 70 level would indicate an oversold situation and a downward correction in the near future.
The market sentiment is reinforced as the GBP/USD pair has surpassed the resistance at 1.3445, reached on April 28, and the highest level since February 2022. The pair could now explore the region around the upper boundary of the ascending channel at 1.3960.
On the downside, the GBP/USD pair may find the primary support at the nine-day EMA of 1.3428, followed by the ascending channel’s lower boundary at 1.3310. A successful break below this crucial support zone could weaken the bullish bias and put downward pressure on the pair to test the 50-day EMA at 1.3188, followed by the monthly low at 1.3139, recorded on May 12.
Medium-term price momentum could weaken if the GBP/USD pair registers further decline and puts downward pressure on the pair to navigate the region around its two-month low at 1.2708, recorded on April 7.
GBP/USD: Daily Chart
British Pound PRICE Today
The table below shows the percentage change of British Pound (GBP) against listed major currencies today. British Pound was the strongest against the Swiss Franc.
| USD | EUR | GBP | JPY | CAD | AUD | NZD | CHF | |
|---|---|---|---|---|---|---|---|---|
| USD | -0.35% | -0.38% | 0.13% | -0.22% | -0.47% | -0.51% | -0.02% | |
| EUR | 0.35% | -0.02% | 0.54% | 0.14% | -0.09% | -0.15% | 0.35% | |
| GBP | 0.38% | 0.02% | 0.21% | 0.16% | -0.09% | -0.13% | 0.39% | |
| JPY | -0.13% | -0.54% | -0.21% | -0.36% | -0.63% | -0.72% | -0.17% | |
| CAD | 0.22% | -0.14% | -0.16% | 0.36% | -0.23% | -0.29% | 0.23% | |
| AUD | 0.47% | 0.09% | 0.09% | 0.63% | 0.23% | -0.08% | 0.48% | |
| NZD | 0.51% | 0.15% | 0.13% | 0.72% | 0.29% | 0.08% | 0.52% | |
| CHF | 0.02% | -0.35% | -0.39% | 0.17% | -0.23% | -0.48% | -0.52% |
The heat map shows percentage changes of major currencies against each other. The base currency is picked from the left column, while the quote currency is picked from the top row. For example, if you pick the British Pound from the left column and move along the horizontal line to the US Dollar, the percentage change displayed in the box will represent GBP (base)/USD (quote).
Author

Akhtar Faruqui
FXStreet
Akhtar Faruqui is a Forex Analyst based in New Delhi, India. With a keen eye for market trends and a passion for dissecting complex financial dynamics, he is dedicated to delivering accurate and insightful Forex news and analysis.


