GBP/USD Price Forecast: Gains ground on soft US jobs data
- GBP/USD bounces from a daily low of 1.3031, with momentum turning bullish as RSI points upward.
- Bulls need to clear resistance at 1.3111 and 1.3143 to target the key psychological level of 1.3200.
- A drop below 1.3000 would expose the 50-DMA at 1.2953, with further support at 1.2872 and 1.2810 (100-DMA).

The Pound Sterling advanced modestly against the US Dollar on Thursday after economic data showed that factory inflation in the United States (US) was a tick higher than foreseen. That and a softer US jobs report weighed on the buck. The GBP/USD trades at 1.3078 after hitting a daily low of 1.3031.
GBP/USD Price Forecast: Technical outlook
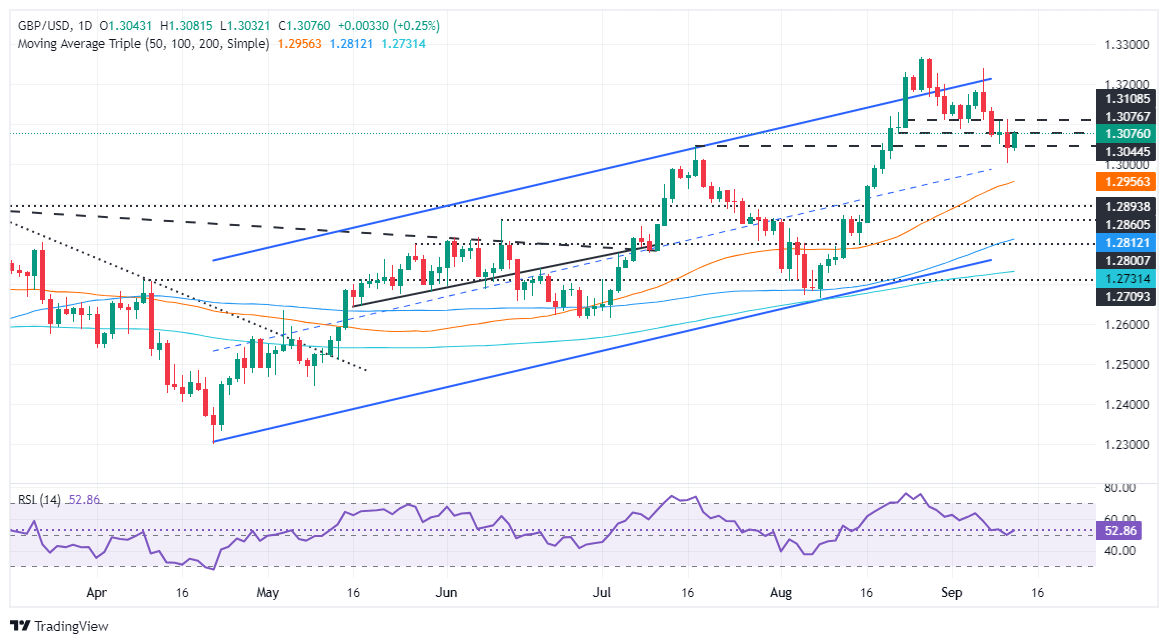
After diving to a three-week low of 1.3001, the GBP/USD bounced off and sat within the mid 1.3000-1.3100 range after UK economic data showed the economy is cooling.
Momentum shows buyers stepping into the market as the Relative Strength Index (RSI), which, at the brisk of turning bearish, made a U-turn, aiming up.
If bulls want to regain control, they must reclaim the September 11 peak of 1.3111. This would expose the current week’s peak at 1.3143, followed by 1.3200.
Conversely for a bearish continuation, if GBP/USD tumbles below 1.3000, the first support would be the 50-day moving average (DMA) at 1.2953. On further weakness, the next stop would be the August 13 high turned support at 1.2872, ahead of challenging 1.2810, the 100-DMA.
GBP/USD Price Action – Daily Chart
British Pound PRICE Today
The table below shows the percentage change of British Pound (GBP) against listed major currencies today. British Pound was the strongest against the Swiss Franc.
| USD | EUR | GBP | JPY | CAD | AUD | NZD | CHF | |
|---|---|---|---|---|---|---|---|---|
| USD | -0.28% | -0.28% | -0.03% | 0.12% | -0.24% | -0.23% | 0.15% | |
| EUR | 0.28% | 0.00% | 0.22% | 0.42% | 0.05% | 0.06% | 0.43% | |
| GBP | 0.28% | -0.01% | 0.00% | 0.41% | 0.04% | 0.05% | 0.43% | |
| JPY | 0.03% | -0.22% | 0.00% | 0.12% | -0.24% | -0.26% | 0.15% | |
| CAD | -0.12% | -0.42% | -0.41% | -0.12% | -0.36% | -0.37% | 0.01% | |
| AUD | 0.24% | -0.05% | -0.04% | 0.24% | 0.36% | 0.00% | 0.38% | |
| NZD | 0.23% | -0.06% | -0.05% | 0.26% | 0.37% | -0.01% | 0.38% | |
| CHF | -0.15% | -0.43% | -0.43% | -0.15% | -0.01% | -0.38% | -0.38% |
The heat map shows percentage changes of major currencies against each other. The base currency is picked from the left column, while the quote currency is picked from the top row. For example, if you pick the British Pound from the left column and move along the horizontal line to the US Dollar, the percentage change displayed in the box will represent GBP (base)/USD (quote).
Author

Christian Borjon Valencia
FXStreet
Markets analyst, news editor, and trading instructor with over 14 years of experience across FX, commodities, US equity indices, and global macro markets.


