GBP/USD Price Forecast: Bullish but stalls at 1.3000
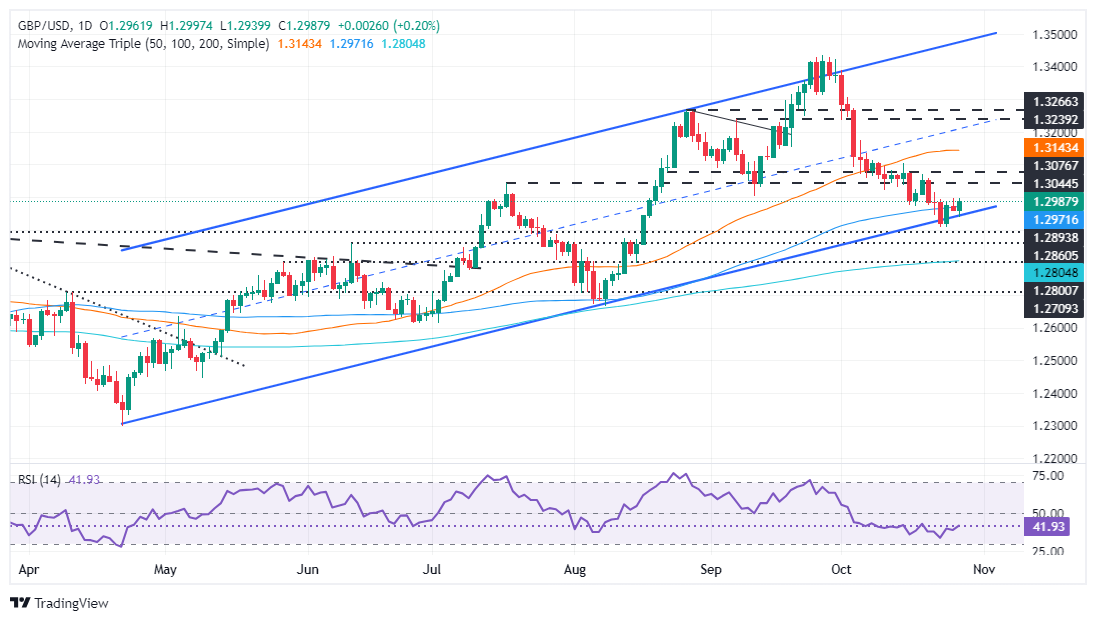
- GBP/USD consolidates below 1.3000, with RSI indicating a slight upward shift but lacking the strength to break recent peaks.
- A GBP/USD breakout above 1.3000 could target resistance at 1.3076 and 1.3102, followed by the 50-day SMA at 1.3140.
- Key support levels lie at the 100-day SMA at 1.2969 and last week’s low of 1.2906, with further downside to the 200-day SMA at 1.2803.

The Pound Sterling recovered some ground against the US Dollar, though it failed for the second consecutive trading day to reach 1.3000. This exacerbated a pullback toward the current exchange rate, as the GBP/USD trades at 1.2981, slightly above 0.20% of its opening price.
GBP/USD Price Forecast: Technical outlook
The GBP/USD consolidates at around the bottom trendline of an ascending channel, shy of cracking 1.3000. Momentum has shifted slightly upwards, with the Relative Strength Index (RSI) slope pointing up. However, the RSI remains below the latest peak, which, once cleared, would mean that buyers are moving in.
If GBP/USD clears 1.3000, the next resistance would be the October 18 peak at 1.3076 before challenging the October 15 daily high at 1.3102. Once surpassed, the 50-day Simple Moving Average (SMA) would be up at 1.3140.
On the other hand, sellers need to clear the 100-day SMA at 1.2969 before challenging last week’s lowest point at 1.2906. On further weakness, bears could drive the GBP/USD to test the 200-day SMA at 1.2803.
GBP/USD Price Chart – Daily
British Pound PRICE Today
The table below shows the percentage change of British Pound (GBP) against listed major currencies today. British Pound was the strongest against the Japanese Yen.
| USD | EUR | GBP | JPY | CAD | AUD | NZD | CHF | |
|---|---|---|---|---|---|---|---|---|
| USD | -0.22% | -0.20% | -0.14% | 0.06% | 0.12% | -0.07% | -0.28% | |
| EUR | 0.22% | 0.12% | 0.02% | 0.28% | 0.42% | 0.14% | -0.05% | |
| GBP | 0.20% | -0.12% | 0.72% | 0.27% | 0.35% | 0.10% | 0.08% | |
| JPY | 0.14% | -0.02% | -0.72% | 0.26% | -0.39% | -0.69% | -0.62% | |
| CAD | -0.06% | -0.28% | -0.27% | -0.26% | 0.00% | -0.21% | -0.32% | |
| AUD | -0.12% | -0.42% | -0.35% | 0.39% | -0.01% | -0.31% | -0.45% | |
| NZD | 0.07% | -0.14% | -0.10% | 0.69% | 0.21% | 0.31% | -0.21% | |
| CHF | 0.28% | 0.05% | -0.08% | 0.62% | 0.32% | 0.45% | 0.21% |
The heat map shows percentage changes of major currencies against each other. The base currency is picked from the left column, while the quote currency is picked from the top row. For example, if you pick the British Pound from the left column and move along the horizontal line to the US Dollar, the percentage change displayed in the box will represent GBP (base)/USD (quote).
Author

Christian Borjon Valencia
FXStreet
Markets analyst, news editor, and trading instructor with over 14 years of experience across FX, commodities, US equity indices, and global macro markets.


