GBP/USD Price Forecast: Bearish bias pushes Cable below 1.2700
- GBP/USD struggles after new four-month low, as US PPI data indicates persistent inflation.
- Technical analysis shows potential for further declines, with next key support at 1.2600.
- Recovery targets for GBP/USD include retesting 1.2700 and aiming for the 200-day SMA at 1.2817.

The British Pound posted losses of 0.10% against the US Dollar after US economic data suggested that inflation remains above the Federal Reserve’s 2% goal. Headline PPI rose the most in four months on an annual basis for October, while core PPI accumulated three straight months of higher readings. The GBP/USD trades at 1.2692 after hitting a daily peak of 1.2710.
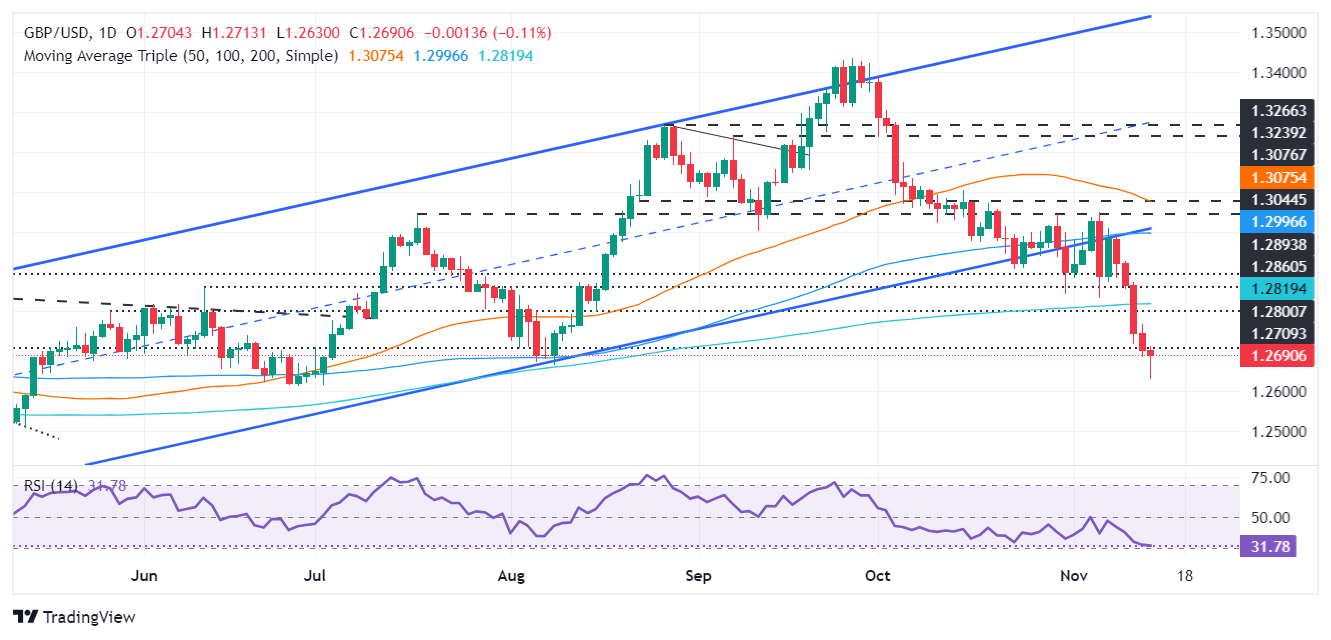
GBP/USD Price Forecast: Technical outlook
The GBP/USD tumbled to a four-month low of 1.2629 before recovering some ground, yet it traded below its opening price. On its way toward 1.2600, the pair printed a lower low beneath the August 8 daily low of 1.2664, paving the way for further losses. Indicators such as the Relative Strength Index (RSI) hint that further downside is seen.
That said, sellers must clear 1.2629 and the 1.2600 figure. Once achieved the next support would be the May 9 low of 1.2445, before challenging the year-to-date (YTD) low of 1.2299.
Conversely, buyers must lift GBP/USD above 1.2700, followed by the November 13 high at 1.2768. They must reclaim the 200-day Simple Moving Average (SMA) at 1.2817 if surpassed.
GBP/USD Price Chart – Daily
British Pound PRICE Today
The table below shows the percentage change of British Pound (GBP) against listed major currencies today. British Pound was the strongest against the Swiss Franc.
| USD | EUR | GBP | JPY | CAD | AUD | NZD | CHF | |
|---|---|---|---|---|---|---|---|---|
| USD | 0.08% | 0.10% | 0.14% | 0.17% | 0.13% | 0.08% | 0.20% | |
| EUR | -0.08% | 0.02% | 0.07% | 0.09% | 0.04% | -0.00% | 0.12% | |
| GBP | -0.10% | -0.02% | 0.06% | 0.08% | 0.03% | -0.02% | 0.10% | |
| JPY | -0.14% | -0.07% | -0.06% | 0.04% | -0.01% | -0.09% | 0.07% | |
| CAD | -0.17% | -0.09% | -0.08% | -0.04% | -0.04% | -0.09% | 0.03% | |
| AUD | -0.13% | -0.04% | -0.03% | 0.00% | 0.04% | -0.04% | 0.08% | |
| NZD | -0.08% | 0.00% | 0.02% | 0.09% | 0.09% | 0.04% | 0.11% | |
| CHF | -0.20% | -0.12% | -0.10% | -0.07% | -0.03% | -0.08% | -0.11% |
The heat map shows percentage changes of major currencies against each other. The base currency is picked from the left column, while the quote currency is picked from the top row. For example, if you pick the British Pound from the left column and move along the horizontal line to the US Dollar, the percentage change displayed in the box will represent GBP (base)/USD (quote).
Author

Christian Borjon Valencia
FXStreet
Markets analyst, news editor, and trading instructor with over 14 years of experience across FX, commodities, US equity indices, and global macro markets.


