|

GBP/USD Price Analysis: Wavers below 1.2500 as bearish harami looms

  • GBP/USD remains steady, slightly down by 0.05% following mixed US PMI data from S&P Global and ISM.
  • The two-candle chart pattern, the bearish harami suggests further downside is seen.
  • Key support levels lie at the April 29 low of 1.2474 could lead to retesting the yearly low at 1.2299.

The Pound Sterling is virtually unchanged against the US Dollar following the release of mixed Purchasing Managers Index (PMI) data from S&P Global and the Institute for Supply Management (ISM). The data showed that the economy is slowing down, amid higher interest rates set by the Federal Reserve. The GBP/USD seesaws around 1.2486, down 0.05%.

GBP/USD Price Analysis: Technical outlook

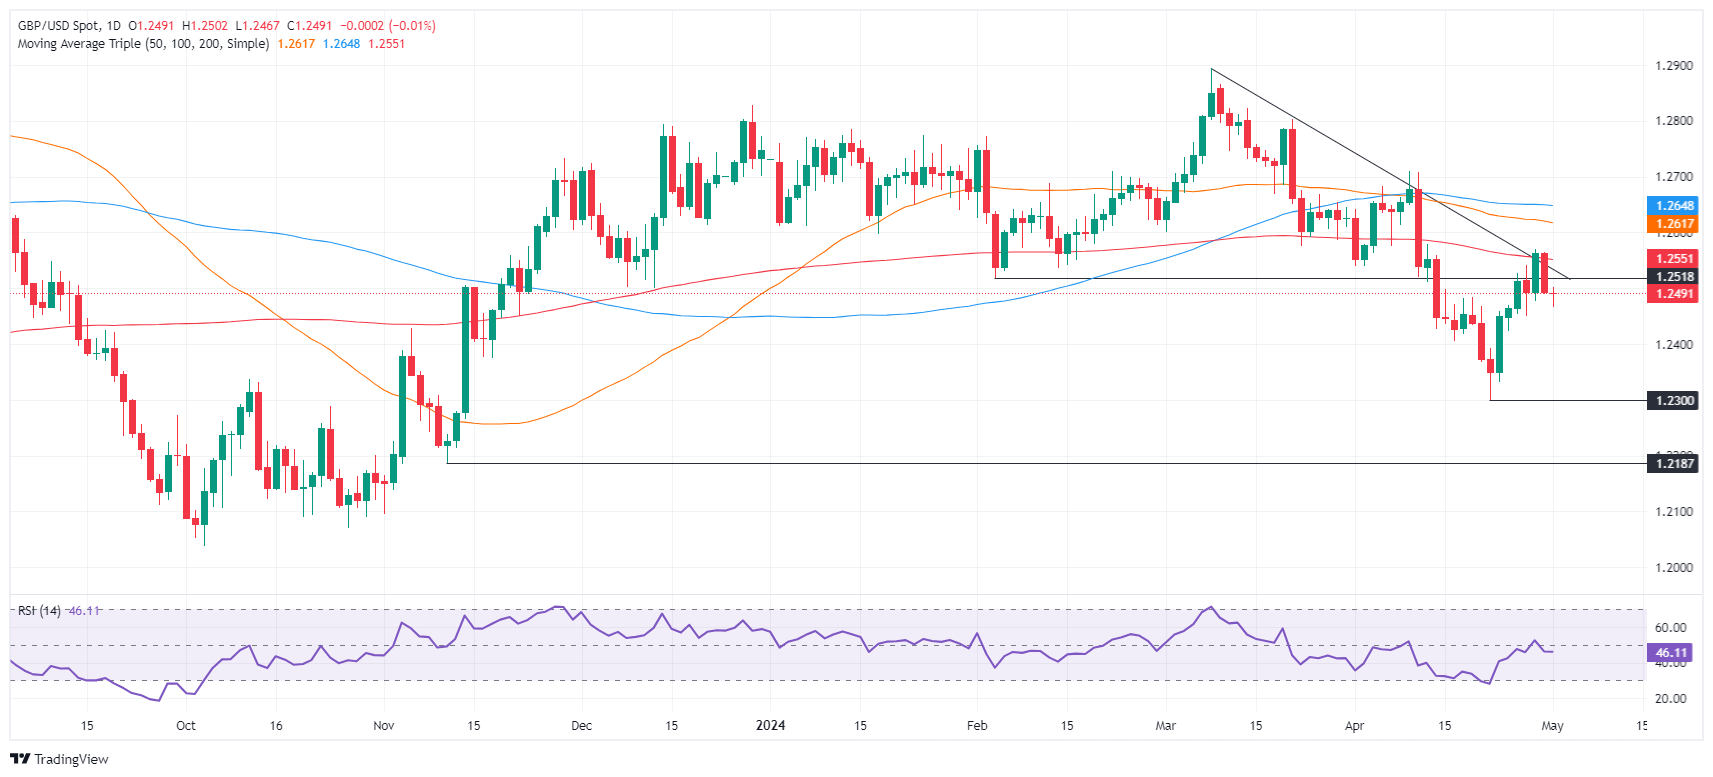
The GBP/USD remains downward biased despite registering an upward impulse that lifted the exchange rate from yearly lows of 1.2299 to April’s high of 1.2569. the advance was capped by strong resistance provided by the 200-day moving average (DMA) at 1.2552, triggering a two-candle bearish formation – bearish harami. This pattern needs a confirmation past the April 29 low of 1.2474, which would exacerbate a test of the latest swing low of 1.2299.

On the other hand, if buyers achieve a daily close above 1.2500, subsequent gains are seen if they challenge the 200-DMA. Once surpassed, the next stop would be the 1.2600 mark.

GBP/USD Price Action – Daily Chart

GBP/USD

Overview
Today last price1.2491
Today Daily Change-0.0001
Today Daily Change %-0.01
Today daily open1.2492
 
Trends
Daily SMA201.2513
Daily SMA501.262
Daily SMA1001.2649
Daily SMA2001.2553
 
Levels
Previous Daily High1.2564
Previous Daily Low1.249
Previous Weekly High1.2542
Previous Weekly Low1.23
Previous Monthly High1.2709
Previous Monthly Low1.23
Daily Fibonacci 38.2%1.2518
Daily Fibonacci 61.8%1.2536
Daily Pivot Point S11.2467
Daily Pivot Point S21.2442
Daily Pivot Point S31.2393
Daily Pivot Point R11.2541
Daily Pivot Point R21.259
Daily Pivot Point R31.2615

Author

Christian Borjon Valencia

Markets analyst, news editor, and trading instructor with over 14 years of experience across FX, commodities, US equity indices, and global macro markets.

More from Christian Borjon Valencia
Share:

Editor's Picks

AUD/USD eyes 0.7150 barrier nine-day EMA

AUD/USD inches higher after registering modest losses in the previous day, trading around 0.7130 during the Asian hours. The technical analysis of the daily chart indicates that the pair is moving sideways within the rectangle pattern, suggesting a consolidation as neither the bulls nor the bears have enough momentum to take control of the market.

USD/JPY trades below 160.00 intervention threshold; bullish bias intact

The USD/JPY pair attracts some sellers during the Asian session amid fears that authorities will step in again to prop up the Japanese Yen. Furthermore, the Israel-Lebanon truce prompts some profit-taking around the US Dollar and exerts downward pressure on the currency pair.

Gold defends 200-day SMA at $4,425, but for how long?

Gold is attempting a tepid recovery toward $4,500 early Thursday, as renewed optimism in the Mideast geopolitical front calms market nerves. This cautious optimism across Asian markets weighs on Oil prices, and diminishes the US Dollar’s safe-haven appeal, helping Gold stage a decent comeback from the weekly low of $4,424.


Hyperliquid: ETF demand, capital rotation fuel HYPE rally as Bitcoin melts

Hyperliquid price sustains an upward trend near its all-time high of $75.76 on Thursday after posting 80% gains in May, while Bitcoin (BTC) retraces below $65,000, triggering a market-wide panic.

Kevin Warsh takes the Fed helm: What it means for the US Dollar
The Federal Reserve moves away from the highly predictable "forward guidance" model of the Jerome Powell era to a new “Kevin Warsh environment”, characterized by less communication, more policy surprises, and an increased focus on the Fed's complex balance sheet.
Recession on paper: What really moves the Canadian Loonie now?

Statistics Canada handed the headline writers a gift and the analysts a headache. Real GDP shrank 0.1% on an annualized basis in the first quarter, and with the fourth quarter of 2025 revised down to a 1.0% contraction, that is two negative quarters in a row, the textbook definition of a technical recession and Canada's first since the pandemic.