EUR/JPY Price Forecast: Hovers around 184.00 above nine-day EMA
- EUR/JPY may target the upper boundary of its horizontal channel near 185.90.
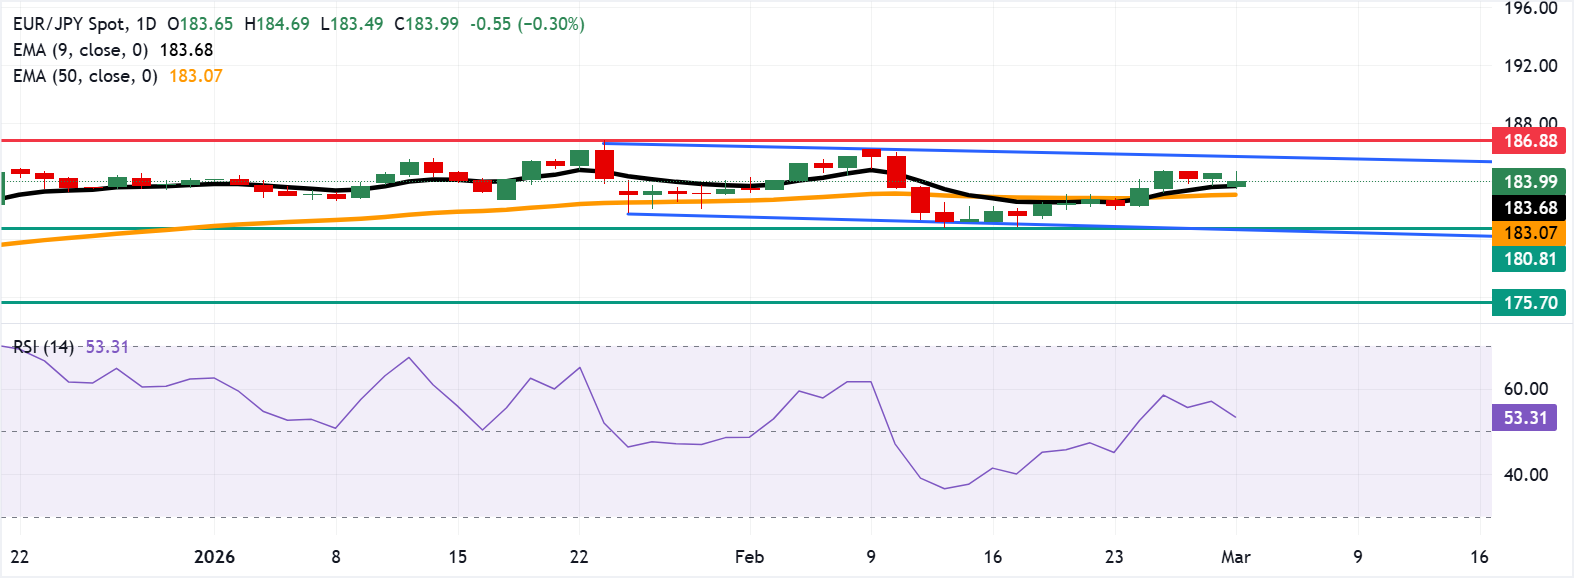
- The 14-day Relative Strength Index at 55.38 signals positive momentum without indicating overbought conditions.
- Primary support stands at the nine-day EMA near 183.69.

EUR/JPY pares daily losses but remains in the negative territory, trading around 184.00 during the early European hours on Monday. The technical analysis of the daily chart shows a consolidation phase as the currency cross remains within the horizontal channel.
The 14-day Relative Strength Index (RSI) at 55.38 sits above its midline and confirms positive momentum rather than overstretched conditions, aligning with scope for further upside while the moving average zone continues to underpin the pair.
The near-term bias stays mildly bullish as spot holds above the clustered nine- and 50-day Exponential Moving Averages (EMAs) around 183.70–183.10, keeping the broader uptrend intact despite recent consolidation.
Price has recovered from last week’s dip toward 181.00 and now trades comfortably above the latest swing area, suggesting buyers retain control on pullbacks. The EUR/JPY cross may target the upper boundary of the horizontal channel around 185.90, followed by the all-time high of 186.88, reached on January 23.
On the downside, primary support lies at the nine-day EMA at 183.69, followed by the 50-day EMA at 183.07. Further declines below the averages would weaken the momentum and expose a two-month low at 180.81, recorded on February 12, aligned with the lower horizontal channel boundary around 180.50. Further declines would cause the emergence of the bearish bias and put downward pressure on the EUR/JPY cross to navigate the region around the four-month low at 175.70.
(The technical analysis of this story was written with the help of an AI tool.)
Euro Price Today
The table below shows the percentage change of Euro (EUR) against listed major currencies today. Euro was the weakest against the US Dollar.
| USD | EUR | GBP | JPY | CAD | AUD | NZD | CHF | |
|---|---|---|---|---|---|---|---|---|
| USD | 0.77% | 0.81% | 0.53% | 0.14% | 0.77% | 0.86% | 0.36% | |
| EUR | -0.77% | 0.05% | -0.26% | -0.62% | 0.00% | 0.10% | -0.40% | |
| GBP | -0.81% | -0.05% | -0.31% | -0.66% | -0.04% | 0.05% | -0.45% | |
| JPY | -0.53% | 0.26% | 0.31% | -0.37% | 0.25% | 0.34% | -0.16% | |
| CAD | -0.14% | 0.62% | 0.66% | 0.37% | 0.62% | 0.71% | 0.22% | |
| AUD | -0.77% | -0.00% | 0.04% | -0.25% | -0.62% | 0.10% | -0.40% | |
| NZD | -0.86% | -0.10% | -0.05% | -0.34% | -0.71% | -0.10% | -0.50% | |
| CHF | -0.36% | 0.40% | 0.45% | 0.16% | -0.22% | 0.40% | 0.50% |
The heat map shows percentage changes of major currencies against each other. The base currency is picked from the left column, while the quote currency is picked from the top row. For example, if you pick the Euro from the left column and move along the horizontal line to the US Dollar, the percentage change displayed in the box will represent EUR (base)/USD (quote).
Author

Akhtar Faruqui
FXStreet
Akhtar Faruqui is a Forex Analyst based in New Delhi, India. With a keen eye for market trends and a passion for dissecting complex financial dynamics, he is dedicated to delivering accurate and insightful Forex news and analysis.


