GBP/USD Price Analysis: Turns vulnerable below a short-term ascending trend-line support


  • GBP/USD remained under some selling pressure for the second straight session on Monday.
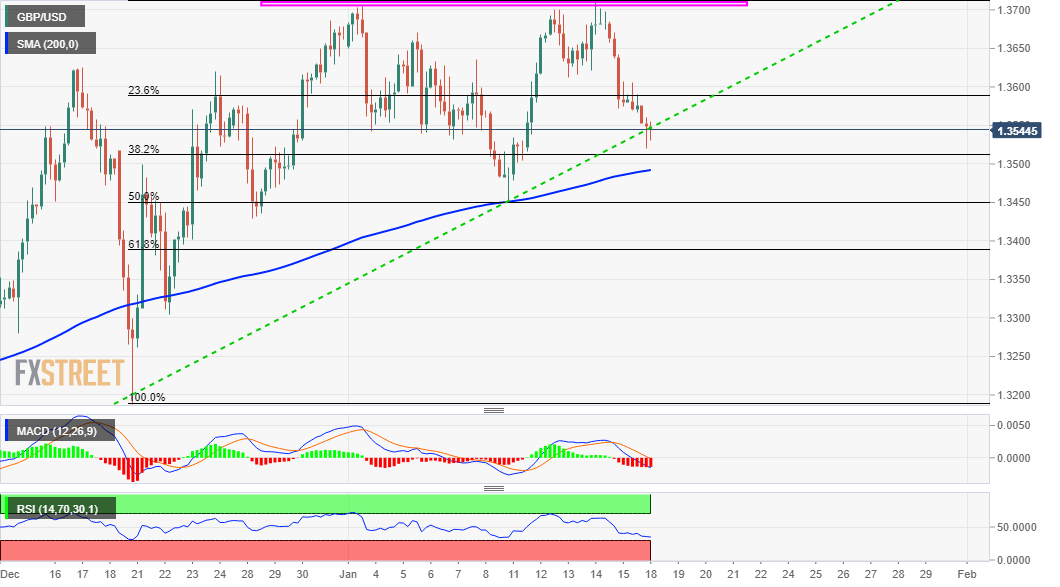
  • Repeated failures near the 1.3700 level constituted the formation of a bearish multiple-tops.
  • A subsequent fall below an ascending trend-line might have set the stage for a further decline.

The GBP/USD pair witnessed some follow-through selling for the second consecutive session on Monday and retreated further from multi-year tops, around the 1.3700-1.3710 region set last week. Repeated failures near the mentioned supply zone constituted the formation of a bearish multiple-top pattern on short-term charts.

Meanwhile, the retracement slide extended through the mid-European session and dragged the GBP/USD pair to multi-day lows, around the 1.3520 region. This marks a bearish break below a near one-month-old ascending trend-line support and might have already set the stage for a further near-term depreciating move.

The bearish outlook is further reinforced by the fact that technical indicators have been gaining negative traction on hourly charts. That said, oscillators on the daily chart – though have been losing positive momentum – are yet to confirm the bearish bias and thus, warrant some caution for aggressive traders.

Hence, it will be prudent to wait for some follow-through selling below the 38.2% Fibonacci level of the 1.3188-1.3710 positive move before placing fresh bearish bets. A subsequent fall below the key 1.3500 psychological mark will reaffirm the negative set-up and drag the GBP/USD pair to 50% Fibo. level, around mid-1.3400s.

On the flip side, any meaningful recovery back above the mentioned trend-line support breakpoint might now be seen as a selling opportunity. This, in turn, should cap the upside for the GBP/USD pair near the 23.6% Fibo. level, or levels just ahead of the 1.3600 mark. However, a sustained strength beyond will negate the negative outlook.

GBP/USD 4-hourly chart

fxsoriginal

Technical levels to watch

GBP/USD

Overview
Today last price 1.3544
Today Daily Change -0.0040
Today Daily Change % -0.29
Today daily open 1.3584
 
Trends
Daily SMA20 1.3567
Daily SMA50 1.3426
Daily SMA100 1.3204
Daily SMA200 1.2914
 
Levels
Previous Daily High 1.3698
Previous Daily Low 1.3572
Previous Weekly High 1.371
Previous Weekly Low 1.3451
Previous Monthly High 1.3686
Previous Monthly Low 1.3134
Daily Fibonacci 38.2% 1.3621
Daily Fibonacci 61.8% 1.365
Daily Pivot Point S1 1.3538
Daily Pivot Point S2 1.3492
Daily Pivot Point S3 1.3412
Daily Pivot Point R1 1.3664
Daily Pivot Point R2 1.3744
Daily Pivot Point R3 1.379


Share: Feed news

Information on these pages contains forward-looking statements that involve risks and uncertainties. Markets and instruments profiled on this page are for informational purposes only and should not in any way come across as a recommendation to buy or sell in these assets. You should do your own thorough research before making any investment decisions. FXStreet does not in any way guarantee that this information is free from mistakes, errors, or material misstatements. It also does not guarantee that this information is of a timely nature. Investing in Open Markets involves a great deal of risk, including the loss of all or a portion of your investment, as well as emotional distress. All risks, losses and costs associated with investing, including total loss of principal, are your responsibility. The views and opinions expressed in this article are those of the authors and do not necessarily reflect the official policy or position of FXStreet nor its advertisers. The author will not be held responsible for information that is found at the end of links posted on this page.

If not otherwise explicitly mentioned in the body of the article, at the time of writing, the author has no position in any stock mentioned in this article and no business relationship with any company mentioned. The author has not received compensation for writing this article, other than from FXStreet.

FXStreet and the author do not provide personalized recommendations. The author makes no representations as to the accuracy, completeness, or suitability of this information. FXStreet and the author will not be liable for any errors, omissions or any losses, injuries or damages arising from this information and its display or use. Errors and omissions excepted.

The author and FXStreet are not registered investment advisors and nothing in this article is intended to be investment advice.

Recommended content


Recommended content

Editors’ Picks

AUD/USD hovers around 0.6500 amid light trading, ahead of US GDP

AUD/USD hovers around 0.6500 amid light trading, ahead of US GDP

AUD/USD is trading close to 0.6500 in Asian trading on Thursday, lacking a clear directional impetus amid an Anzac Day holiday in Australia. Meanwhile, traders stay cautious due ti risk-aversion and ahead of the key US Q1 GDP release. 

AUD/USD News

USD/JPY finds its highest bids since 1990, near 155.50

USD/JPY finds its highest bids since 1990, near 155.50

USD/JPY keeps breaking into its highest chart territory since June of 1990 early Thursday, testing 155.50 for the first time in 34 years as the Japanese Yen remains vulnerable, despite looming Japanese intervention risks. Focus shifts to Thursday's US GDP report and the BoJ decision on Friday. 

USD/JPY News

Gold price treads water near $2,320, awaits US GDP data

Gold price treads water near $2,320, awaits US GDP data

Gold price recovers losses but keeps its range near $2,320 early Thursday. Renewed weakness in the US Dollar and the US Treasury yields allow Gold buyers to breathe a sigh of relief. Gold price stays vulnerable amid Middle East de-escalation, awaiting US Q1 GDP data. 

Gold News

Injective price weakness persists despite over 5.9 million INJ tokens burned

Injective price weakness persists despite over 5.9 million INJ tokens burned

Injective price is trading with a bearish bias, stuck in the lower section of the market range. The bearish outlook abounds despite the network's deflationary efforts to pump the price. Coupled with broader market gloom, INJ token’s doomed days may not be over yet.

Read more

Meta Platforms Earnings: META sinks 10% on lower Q2 revenue guidance Premium

Meta Platforms Earnings: META sinks 10% on lower Q2 revenue guidance

This must be "opposites" week. While Doppelganger Tesla rode horrible misses on Tuesday to a double-digit rally, Meta Platforms produced impressive beats above Wall Street consensus after the close on Wednesday, only to watch the share price collapse by nearly 10%.

Read more

Forex MAJORS

Cryptocurrencies

Signatures