|

GBP/USD Price Analysis: To remain inside the woods till the release of Fed’s interest rate policy

  • GBP/USD is displaying a sideways auction as the focus has shifted to Fed policy.
  • The BoE policymakers are preparing for a 12th consecutive interest rate hike to tame double-digit UK inflation.
  • The current variation of the Rising Channel lacks strength and is signaling a loss in the upside momentum.

The GBP/USD pair is demonstrating a sideways performance after around 1.2470 after a recovery move from 1.2440 in the early Toyo session. The Cable has defended its crucial support of 1.2440 for now, however, uncertainty will remain ahead of the interest rate policy by the Federal Reserve (Fed).

S&P500 futures have added more losses in early Asia after an extremely bearish Tuesday as concerns over a delay in the United States debt ceiling and deepening fears of a recession ahead of the Fed policy have dented the confidence of investors.

The US Dollar Index (DXY) is consolidating below 102.00 after a healthy correction from 102.30 as an extension in the debt ceiling would impact the long-term outlook of the US economy.

On the Pound Sterling front, Bank of England (BoE) policymakers are preparing for a 12th consecutive interest rate hike to tame double-digit United Kingdom inflation.

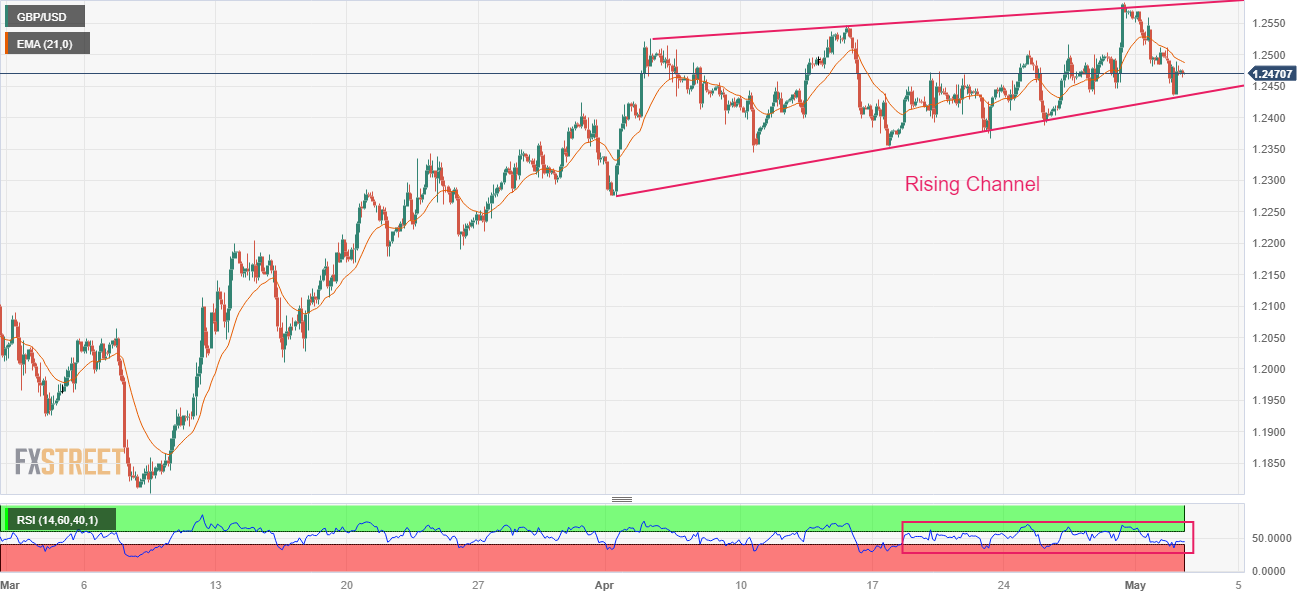
GBP/USD is auctioning in a Rising Channel chart pattern on a two-hour scale. The current variation of the Rising Channel lacks strength and is signaling a loss in the upside momentum. The upper portion of the aforementioned chart pattern is plotted from April 04 high at 1.2525 while the lower portion is placed from April 03 low at 1.2275.

The Cable is below the 20-period Exponential Moving Average (EMA) at 1.2488, indicating that US Dollar bulls have an upper hand.

Meanwhile, the Relative Strength Index (RSI) (14) is oscillating in the 40.00-60.00 range, signaling an action only after the Fed’s monetary policy.

A decisive move above April 14 high at 1.2546 will drive the asset towards a fresh 10-month high at 1.2597, which is 08 June 2022 high. A breach of the latter will expose the asset to May 27 high at 1.2667.

On the flip side, a slippage below April 10 low at 1.2345 will expose the asset to March 30 low at 1.2294 followed by March 27 low at 1.2219.

GBP/USD two-hour chart

GBP/USD

Overview
Today last price1.2472
Today Daily Change-0.0024
Today Daily Change %-0.19
Today daily open1.2496
 
Trends
Daily SMA201.2455
Daily SMA501.226
Daily SMA1001.2214
Daily SMA2001.1942
 
Levels
Previous Daily High1.2571
Previous Daily Low1.2481
Previous Weekly High1.2584
Previous Weekly Low1.2387
Previous Monthly High1.2584
Previous Monthly Low1.2275
Daily Fibonacci 38.2%1.2515
Daily Fibonacci 61.8%1.2536
Daily Pivot Point S11.2461
Daily Pivot Point S21.2426
Daily Pivot Point S31.2371
Daily Pivot Point R11.2551
Daily Pivot Point R21.2606
Daily Pivot Point R31.2642

Author

Sagar Dua

Sagar Dua

FXStreet

Sagar Dua is associated with the financial markets from his college days. Along with pursuing post-graduation in Commerce in 2014, he started his markets training with chart analysis.

More from Sagar Dua
Share:

Markets move fast. We move first.

Orange Juice Newsletter brings you expert driven insights - not headlines. Every day on your inbox.

By subscribing you agree to our Terms and conditions.

Editor's Picks

EUR/USD bounces toward 1.1750 as US Dollar loses strength

EUR/USD returned to the 1.1750 price zone in the American session on Friday, despite falling Wall Street, which indicates risk aversion. Trading conditions remain thin following the New Year holiday and ahead of the weekend, with the focus shifting to US employment and European data scheduled for next week.

GBP/USD nears 1.3500, holds within familiar levels

After testing 1.3400 on the last day of 2025, GBP/USD managed to stage a rebound. Nevertheless, the pair finds it difficult to gather momentum and trades with modest intraday gains at around 1.3490 as market participants remain in holiday mood.

Gold trims intraday gains, approaches $4,300

Gold retreated sharply from the $4,400  area and trades flat for the day in the $4,320 price zone. Choppy trading conditions exacerbated the intraday decline, although XAU/USD bearish case is out of the picture, considering growing expectations for a dovish Fed and persistent geopolitical tensions.

Cardano gains early New Year momentum, bulls target falling wedge breakout

Cardano kicks off the New Year on a positive note and is extending gains, trading above $0.36 at the time of writing on Friday. Improving on-chain and derivatives data point to growing bullish interest, while the technical outlook keeps an upside breakout in focus.

Economic outlook 2026-2027 in advanced countries: Solidity test

After a year marked by global economic resilience and ending on a note of optimism, 2026 looks promising and could be a year of solid economic performance. In our baseline scenario, we expect most of the supportive factors at work in 2025 to continue to play a role in 2026.

Crypto market outlook for 2026

Year 2025 was volatile, as crypto often is.  Among positive catalysts were favourable regulatory changes in the U.S., rise of Digital Asset Treasuries (DAT), adoption of AI and tokenization of Real-World-Assets (RWA).