|

GBP/USD Price Analysis: Thursday’s “Hanging Man” tests buyers near 1.3550

  • GBP/USD keeps bounce off three-week-old support despite posting bearish candlestick the previous day.
  • Multiple failures to cross 100-DMA, nearly overbought RSI challenges upside momentum.
  • 61.8% Fibonacci Retracement adds to the upside filters, 50-DMA to lure bears after immediate trend line support.

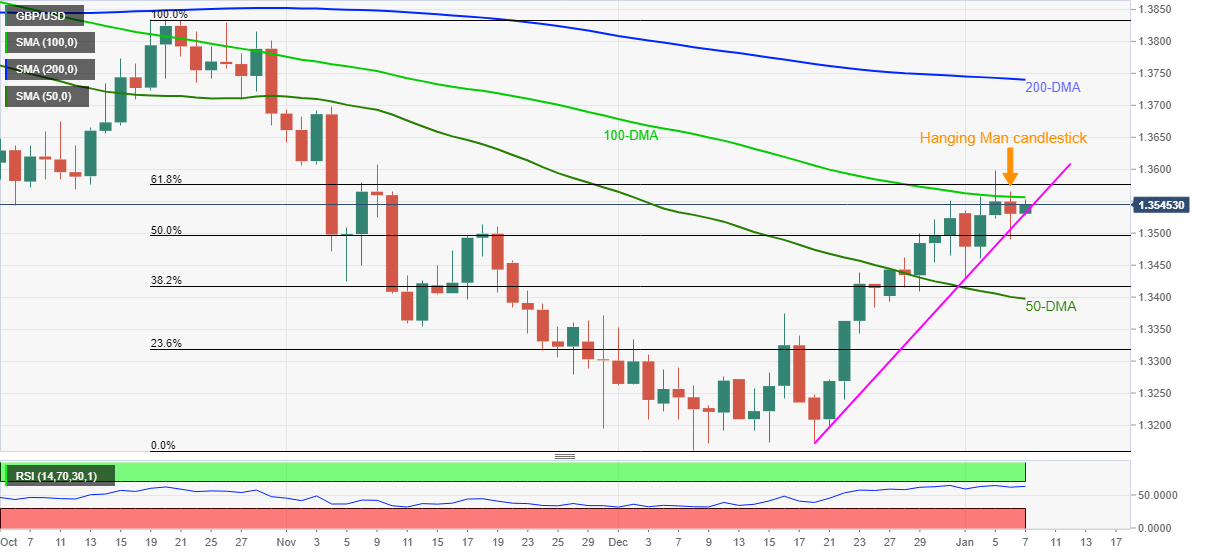
GBP/USD seesaws around 1.3550, up 0.12% intraday heading into Friday’s London open. In doing so, the cable pair stays firmer around a two-month top despite the previous day’s bearish candlestick formation, namely “Hanging Man”.

While an ascending support line from December 20 favors the corrective pullback, the 100-DMA challenges immediate upside around 1.3560 amid nearly overbought RSI conditions suggesting consolidation of recent gains.

Even if the quote manages to cross the 1.3560 immediate hurdle, 61.8% Fibonacci retracement (Fibo.) of October-December declines, around 1.3575, challenges the GBP/USD buyers before directing them to November 09 swing high close to 1.3610.

Alternatively, a downside break of the stated support line, near 1.3530 by the press time, will drag the quote towards the 50-DMA level of 1.3400, wherein the 50% Fibo. level surrounding 1.3500 may offer an intermediate halt.

During the GBP/USD weakness past 50-DMA, tops marked during late November and mid-December, around 1.3370-75, will be important to watch.

Overall, GBP/USD bulls have multiple hurdles to keep the reins while sellers have brighter scope for entries.

GBP/USD: Daily chart

Trend: Pullback expected

Additional important levels

Overview
Today last price1.3546
Today Daily Change0.0016
Today Daily Change %0.12%
Today daily open1.353
 
Trends
Daily SMA201.3383
Daily SMA501.34
Daily SMA1001.3557
Daily SMA2001.3741
 
Levels
Previous Daily High1.3565
Previous Daily Low1.3491
Previous Weekly High1.355
Previous Weekly Low1.3393
Previous Monthly High1.355
Previous Monthly Low1.3161
Daily Fibonacci 38.2%1.3519
Daily Fibonacci 61.8%1.3536
Daily Pivot Point S11.3492
Daily Pivot Point S21.3454
Daily Pivot Point S31.3418
Daily Pivot Point R11.3566
Daily Pivot Point R21.3603
Daily Pivot Point R31.364

Author

Anil Panchal

Anil Panchal

FXStreet

Anil Panchal has nearly 15 years of experience in tracking financial markets. With a keen interest in macroeconomics, Anil aptly tracks global news/updates and stays well-informed about the global financial moves and their implications.

More from Anil Panchal
Share:

Editor's Picks

AUD/USD falls to near 0.7100 after slipping below 50-day EMA

AUD/USD depreciates after registering minor gains in the previous day, trading around 0.7120 during the Asian hours. The technical analysis of the daily chart shows the pair consolidating sideways within a rectangle pattern, as neither bulls nor bears gain control. The AUD/USD pair is holding a slight bearish tone however as it sits beneath both the nine-day and 50-day EMAs.

160.00: USD/JPY back near intervention territory after upbeat US jobs report

US Nonfarm Payrolls beat expectations by a wide margin in May, with 172K jobs added. The US Dollar rebounds after the release, helping USD/JPY recover from its intraday lows. Warnings from Japanese authorities continue to limit upside potential near the 160.00 threshold.

Gold weakens to three-month lows near $4,300

Gold faces increasing selling interest and approaches the area of three-month lows near the $4,300 mark per troy ounce on Friday. The precious metal’s decline comes as traders assess the stronger-than-expected NFP, while the bid bias in the Greenback and higher US Treasury yields also collaborate with the retracement.

Cardano hits five-year low even as Hoskinson clarifies "break" isn't an exit

Cardano (ADA) price is down 10% at press time on Friday, extending losses over 30% so far this week amid Charles Hoskinson's clarification that "break" isn't an exit.

Week ahead – Fed countdown begins amid US inflation data and geopolitical risks

Fed Chair Warsh’s first meeting approaches as key US inflation data could reshape expectations. Oil prices remain elevated as US-Iran talks continue; tariffs also return to the spotlight. ECB is expected to hike; will it be a one-off move or is July live?

The US economy defies the rules: 100 days into the Oil shock and the recession signal is still missing

More than three months after the start of the Iran war and the resulting disruption to global energy markets, the US economy continues to display remarkable resilience. The conflict has triggered a sharp rise in Oil prices, reignited inflationary pressures and fueled widespread concerns about a potential economic slowdown.