|

GBP/USD Price Analysis: Surges toward 1.2700 on US Dollar weakness

  • GBP/USD up 0.40%, boosted as the US Dollar Index (DXY) hits a new two-day low.
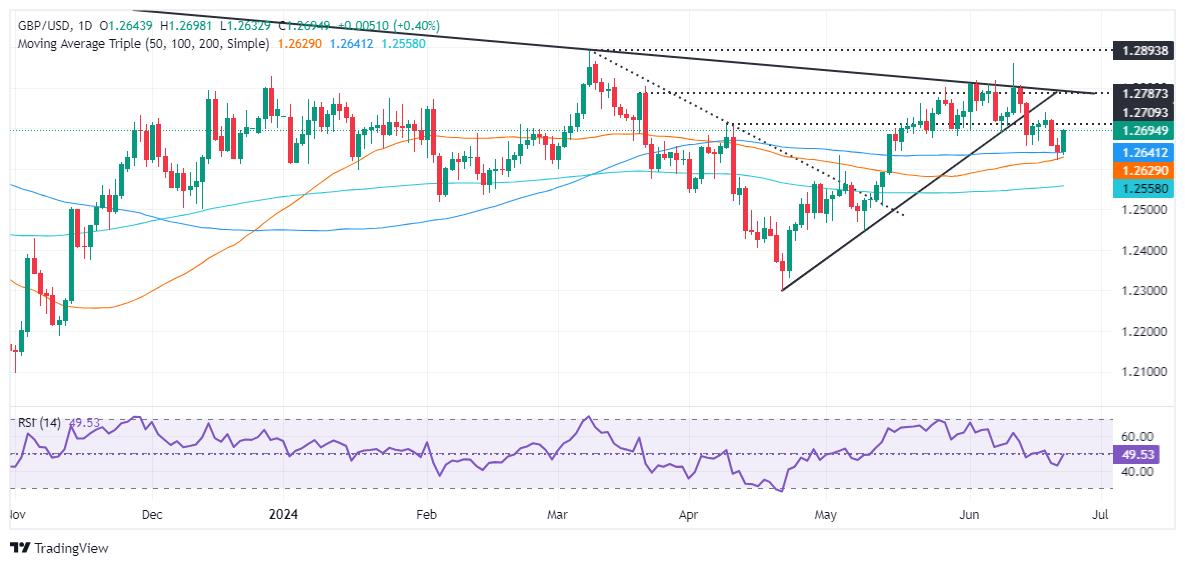
  • Technical outlook neutral to slightly bearish, with RSI signaling bearish momentum.
  • Key support levels at 100-DMA (1.2664), 50-DMA (1.2627), 1.2600, and 200-DMA (1.2553).
  • Resistance at 1.2700 and 1.2750, with less likelihood of being tested in the near term.

The Pound Sterling climbs sharply against the US Dollar as US Treasury bond yields remain unchanged, but the Greenback remains softer as it falls to a fresh two-day low, as depicted by the US Dollar Index (DXY). With the DXY dropping below 105.50, the GBP/USD rose and traded at 1.2691, up 0.40%.

GBP/USD Price Analysis: Technical outlook

From a daily chart perspective, the GBP/USD is neutral to slightly downward biased, even though the exchange rate trades above the daily moving averages (DMA).

The Relative Strength Index (RSI) turned bearish, hinting that sellers are in charge. It is eyeing a break of key support levels, which, once cleared, could cause the GBP/USD to re-test year-to-date (YTD) lows.

 The first support would be the 100-DMA at 1.26643, ahead of the 50-DMA at 1.2627. A further downside lies beneath at 1.2600, exposing the 200-DMA at 1.2553 once surpassed. A breach of the latter, the pair will test 1.2500.

Conversely, and the less likely path in the near term, the GBP/USD first resistance level would be 1.2700. Once hurdle, the next stop would be 1.2750.

GBP/USD Price Action – Daily Chart

GBP/USD

Overview
Today last price1.269
Today Daily Change0.0046
Today Daily Change %0.36
Today daily open1.2644
 
Trends
Daily SMA201.2737
Daily SMA501.2624
Daily SMA1001.264
Daily SMA2001.2556
 
Levels
Previous Daily High1.2676
Previous Daily Low1.2623
Previous Weekly High1.274
Previous Weekly Low1.2623
Previous Monthly High1.2801
Previous Monthly Low1.2446
Daily Fibonacci 38.2%1.2643
Daily Fibonacci 61.8%1.2656
Daily Pivot Point S11.2619
Daily Pivot Point S21.2594
Daily Pivot Point S31.2565
Daily Pivot Point R11.2672
Daily Pivot Point R21.2701
Daily Pivot Point R31.2726

Author

Christian Borjon Valencia

Christian Borjon began his career as a retail trader in 2010, mainly focused on technical analysis and strategies around it. He started as a swing trader, as he used to work in another industry unrelated to the financial markets.

More from Christian Borjon Valencia
Share:

Markets move fast. We move first.

Orange Juice Newsletter brings you expert driven insights - not headlines. Every day on your inbox.

By subscribing you agree to our Terms and conditions.

Editor's Picks

EUR/USD eyes 1.1800 barrier near two-month highs

EUR/USD extends its gains for the second consecutive day on Tuesday and approaches 1.1800. On the daily chart, technical analysis indicates a persistent bullish bias, as the pair moves upward within the ascending channel pattern. Additionally, the 14-day Relative Strength Index at 68.89 reaffirms the bullish bias.

GBP/USD climbs to 1.3500 area, renews ten-week high

GBP/USD extends its weekly rally and trades at its highest level since early October near 1.3500. The US Dollar remains under persistent bearish pressure heading into the holidays, while Pound traders largely brush off the latest interest rate cut from the Bank of England.

Gold approaches $4,500 as record-setting rally continues

Gold builds on Monday's impressive gains and advances toward $4,500, setting fresh record-highs along the way. Heightened geopolitical tensions, combined with the broad-based US Dollar (USD) weakness ahead of the Q3 GDP data, help XAU/USD preserve its bullish momentum.

US GDP expected to highlight steady growth in Q3

The United States Bureau of Economic Analysis (BEA) will publish the first preliminary estimate of the third-quarter Gross Domestic Product on Tuesday, at 13:30 GMT. Analysts expect the data to show annualized growth of 3.2%, following the 3.8% expansion in the previous quarter.

Ten questions that matter going into 2026

2026 may be less about a neat “base case” and more about a regime shift—the market can reprice what matters most (growth, inflation, fiscal, geopolitics, concentration). The biggest trap is false comfort: the same trades can look defensive… right up until they become crowded.

XRP steadies above $1.90 support as fund inflows and retail demand rise

Ripple (XRP) is stable above support at $1.90 at the time of writing on Monday, after several attempts to break above the $2.00 hurdle failed to materialize last week. Meanwhile, institutional interest in the cross-border remittance token has remained steady.