|

GBP/USD Price Analysis: Stays pressured towards 1.3155

  • GBP/USD pauses on the way to fresh yearly low.
  • 200-week SMA, 38.2% Fibonacci retracement offers strong support.
  • October’s bottom guards immediate upside, half-yearly resistance line is the key.

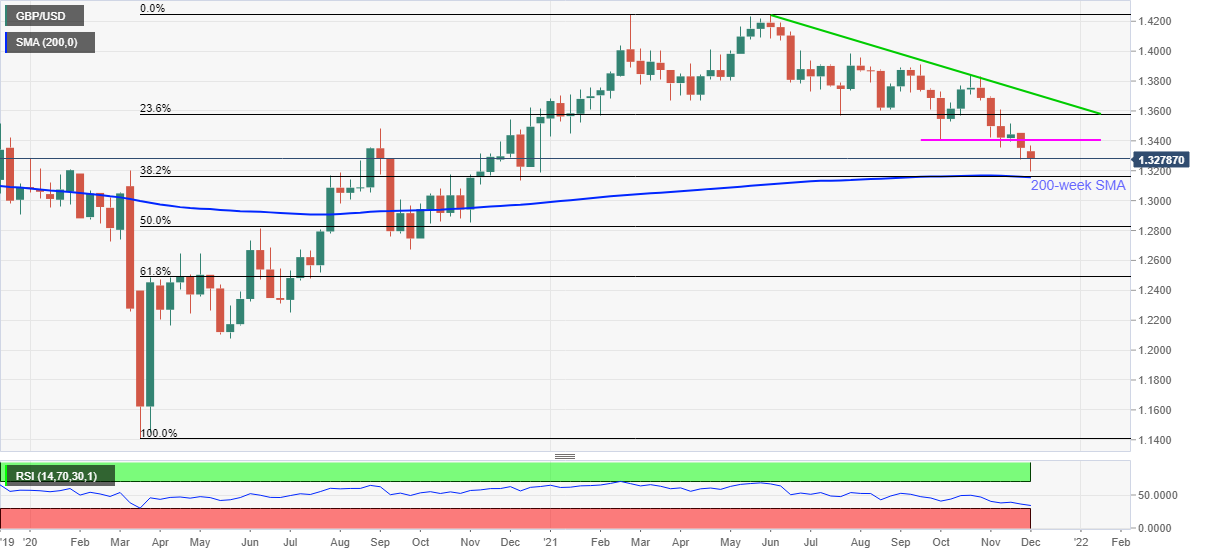
GBP/USD holds lower grounds near 1.3280, retreating towards the yearly low during Thursday’s Asian session. Although the cable pair grinds above the 2021 bottom marked on Tuesday, descending RSI line and sustained trading below the short-term key support, now resistance, keeps bears hopeful.

That said, a convergence of the 38.2% Fibonacci retracement (Fibo.) of March 2020 to June 2021 upside and 200-week SMA surrounding 1.3155 lures the sellers should they manage to conquer the latest yearly low of 1.3194.

It should be noted, however, that the RSI line inches closer to the oversold territory and hence can stop the GBP/USD bears around the stated strong support of 1.3155, failing to which can direct the quote towards the 1.3000 psychological magnet.

Meanwhile, an upside break of the October’s low surrounding 1.3410 becomes necessary for even short-term buyers to take the risk. Following that, 23.6% Fibo. level of 1.3580 may lure the bulls.

However, GBP/USD advances past 1.3588 will be considered elusive until the quote stays below a six-month-old descending resistance line, around 1.3720 by the press time.

GBP/USD: Weekly chart

Trend: Further weakness expected

Additional important levels

Overview
Today last price1.3278
Today Daily Change-0.0023
Today Daily Change %-0.17%
Today daily open1.3301
 
Trends
Daily SMA201.3432
Daily SMA501.3572
Daily SMA1001.3684
Daily SMA2001.3813
 
Levels
Previous Daily High1.3371
Previous Daily Low1.3194
Previous Weekly High1.3457
Previous Weekly Low1.3278
Previous Monthly High1.3698
Previous Monthly Low1.3194
Daily Fibonacci 38.2%1.3262
Daily Fibonacci 61.8%1.3303
Daily Pivot Point S11.3207
Daily Pivot Point S21.3113
Daily Pivot Point S31.3031
Daily Pivot Point R11.3383
Daily Pivot Point R21.3465
Daily Pivot Point R31.3559

Author

Anil Panchal

Anil Panchal

FXStreet

Anil Panchal has nearly 15 years of experience in tracking financial markets. With a keen interest in macroeconomics, Anil aptly tracks global news/updates and stays well-informed about the global financial moves and their implications.

More from Anil Panchal
Share:

Editor's Picks

EUR/USD stays well offered below 1.1800

The selling pressure on EUR/USD is picking up pace, with the pair slipping decisively below the key 1.1800 level and sliding to fresh two week lows as Wednesday’s session draws to a close. The move lower comes as the US Dollar finds renewed strength after the latest round of US data and the release of the FOMC Minutes. Next of note on the docket will be the US weekly Initial Jobless Claims.
 

GBP/USD reaches multi-day lows near 1.3500

GBP/USD reverses its initial upside momentum and is now adding to previous declines, approaching the 1.3500 region on Wednesday. Cable’s downtick comes on the back of decent gains in the Greenback and easing UK inflation figures, which seem to have reinforced the case for a BoE rate cut in March.

Gold battle to regain $5,000 continues

Gold is back on the front foot on Wednesday, shaking off part of the early week softness and challenging two-day highs near the $5,000 mark per troy ounce. The move comes ahead of the FOMC Minutes and is unfolding despite an intense rebound in the US Dollar.

Bitcoin has found or is near a bottom, extended consolidation to follow: K33

Bitcoin (BTC) is nearing or has already established a bottom, which could be followed by a sustained period of slow price movement, according to K33.

Mixed UK inflation data no gamechanger for the Bank of England

Food inflation plunged in January, but service sector price pressure is proving stickier. We continue to expect Bank of England rate cuts in March and June. The latest UK inflation read is a mixed bag for the Bank of England, but we doubt it drastically changes the odds of a March rate cut.

Sui extends sideways action ahead of Grayscale’s GSUI ETF launch

Sui is extending its downtrend for the second consecutive day, trading at 0.95 at the time of writing on Wednesday. The Layer-1 token is down over 16% in February and approximately 34% from the start of the year, aligning with the overall bearish sentiment across the crypto market.