|

GBP/USD Price Analysis: Retreats from the daily highs, steadily around 1.2080

  • GBP/USD trims some of last Friday’s losses but remains trapped between the 20 and 50-DMA.
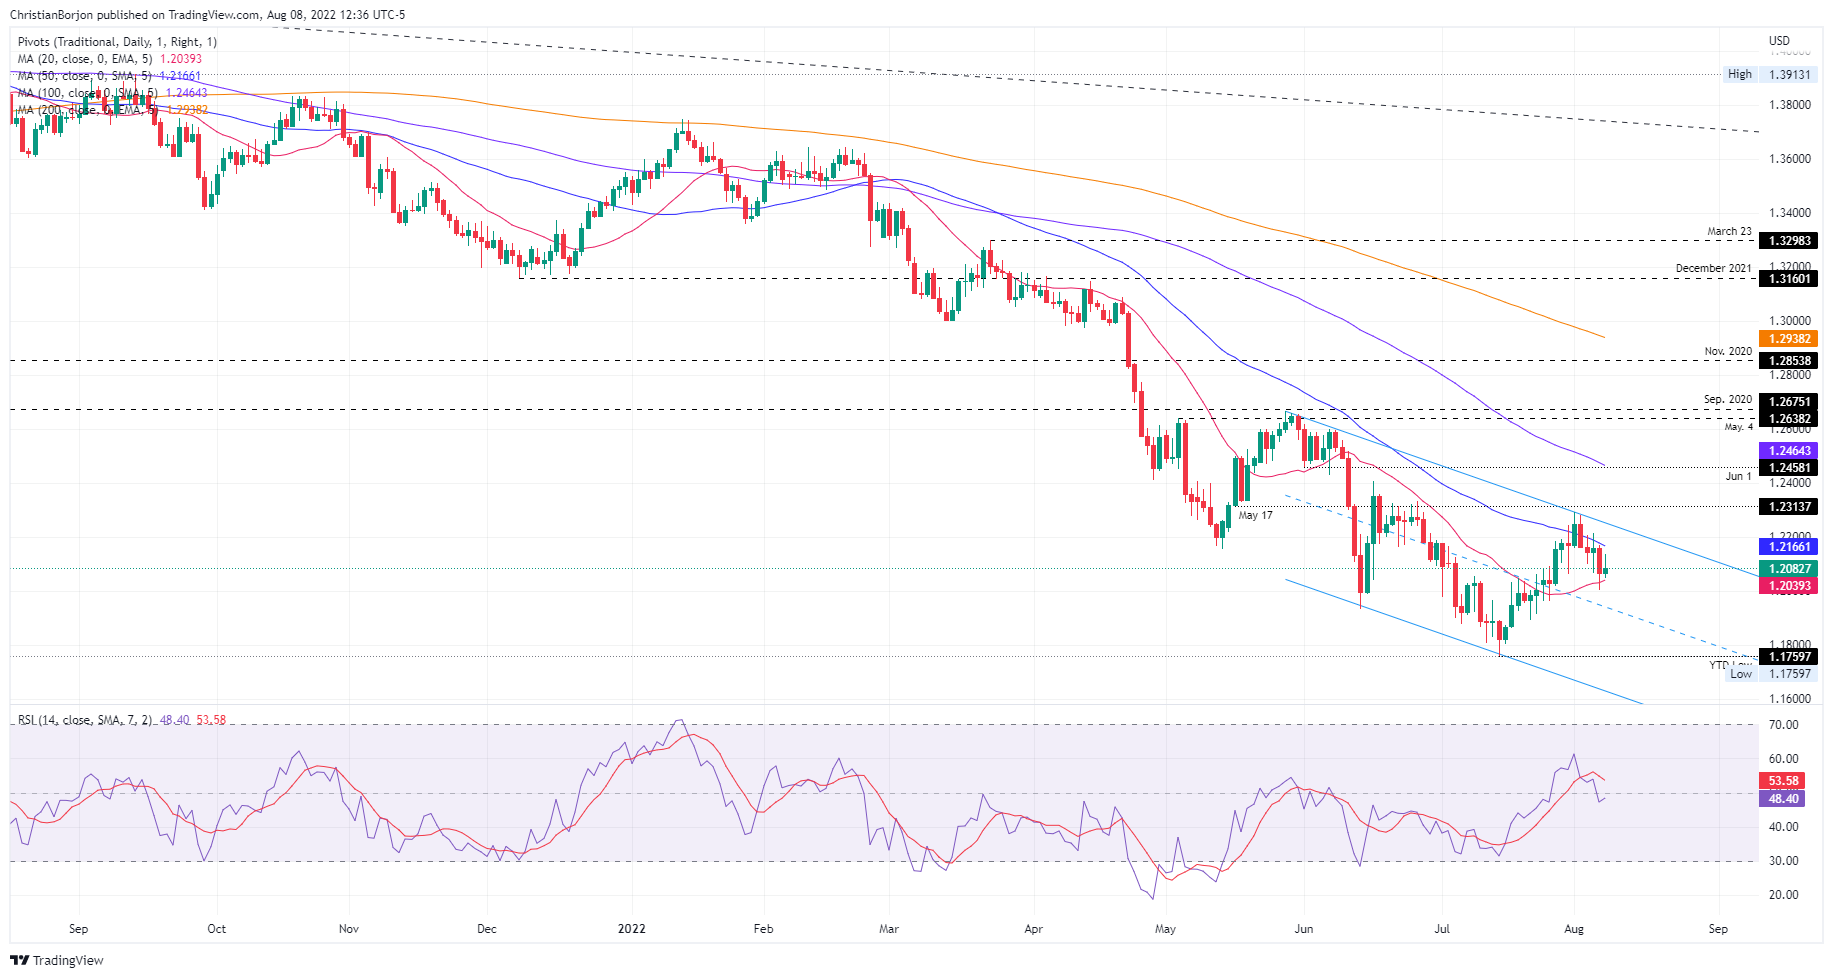
  • The daily chart depicts the pair trending between a descending channel as sellers eye the 20-day EMA.
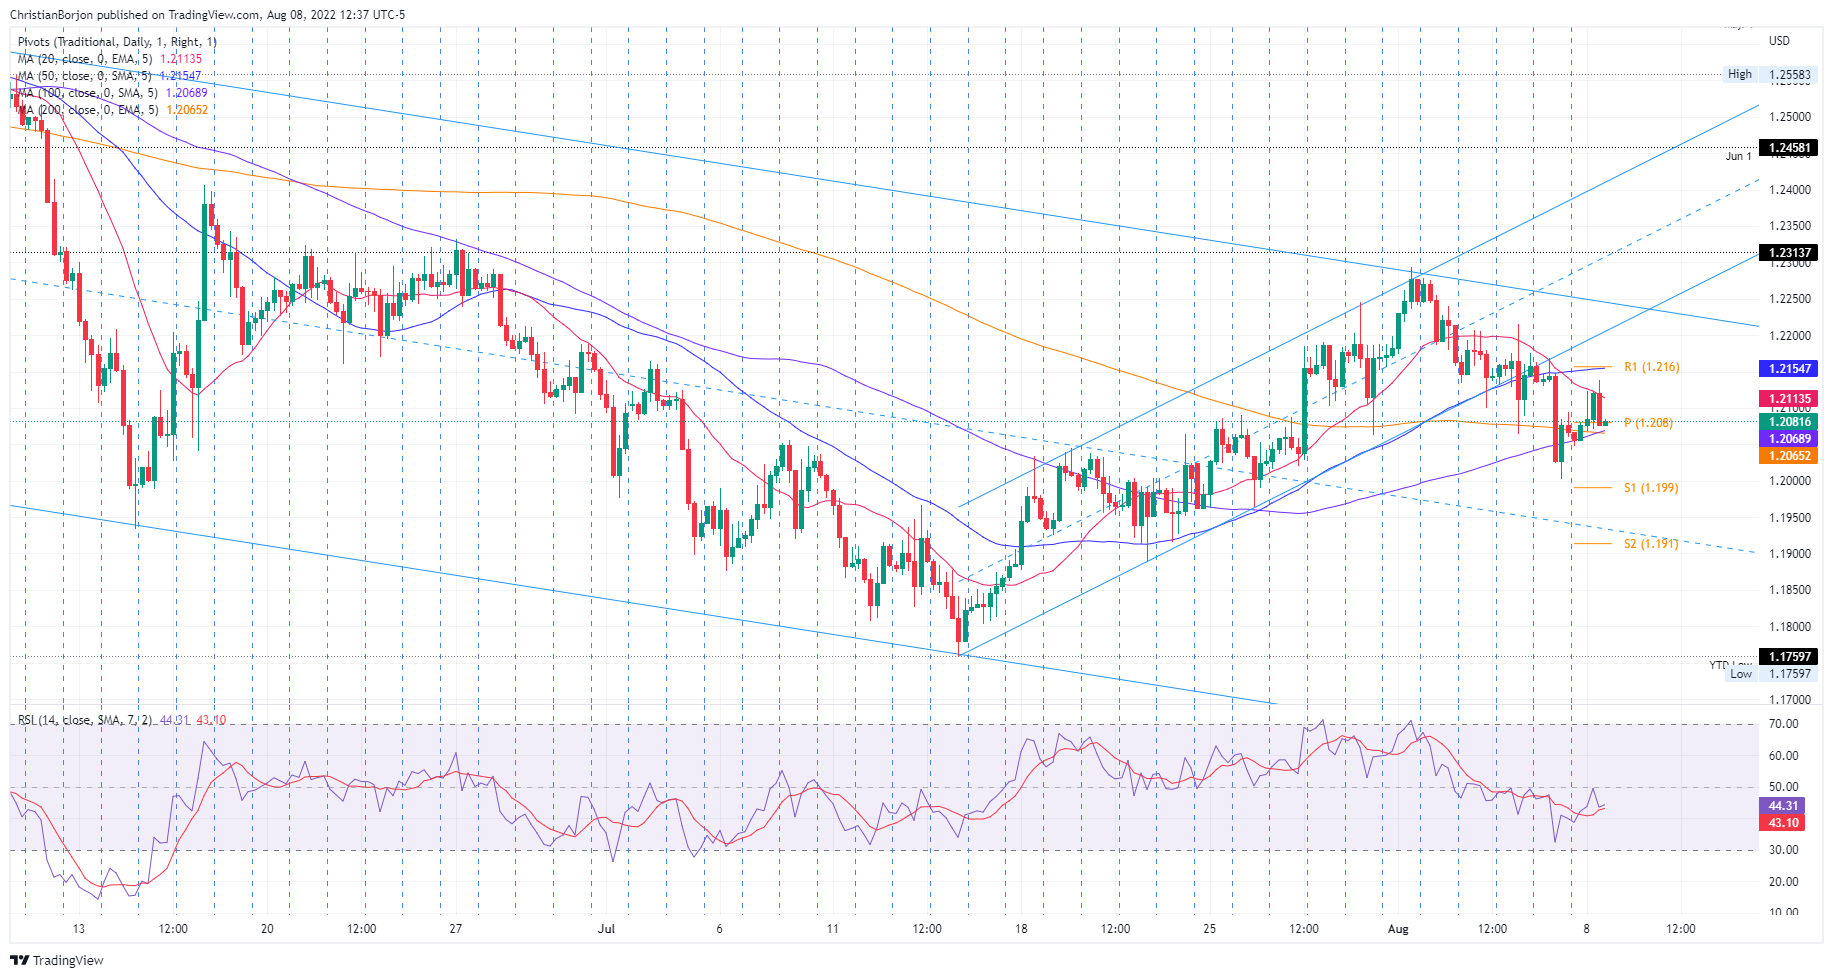
  • The GBP/USD 4-hour scale depicts the pair as neutral-downward biased and might test the 1.2000 figure, short term.

The GBP/USD records minimal gains after hitting a daily high at 1.2137, shy of the 50-day EMA at 1.2166, which has proven to be solid resistance in the last four days. However, the British pound retreated under 1.2100 but remained above the opening price, recording gains of 0.12%. At the time of writing, the GBP/USD is trading at 1.2081.

GBP/USD Price Analysis: Technical outlook

The GBP/USD daily chart illustrates the major as neutral-to-downward biased. Further confirmation of the previously mentioned is that sellers are gathering momentum, as shown by the Relative Strength Index (RSI), aiming lower, residing below the 50-midline. Also, the major trades within a descending channel and the spot price is 50 pips shy of the 20-day EMA at 1.2039. Once cleared, it would exacerbate a fall towards the bottom of the channel, near the YTD low at 1.1759.

GBP/USD Daily chart

Meanwhile, the GBP/USD 4-hour chart shows that an ascending channel was broken to the downside last Friday, adding further selling pressure on the pair. Worth noting that GBP/USD buyers lifted the pair from the confluence of the 100 and 200-EMAs, near the 1.2040s lows of the day. However, sellers piling around the 20-EMA at 1.2113 weighed on the pair, which slid below the 1.2100 mark.

Hence, the GBP/USD 4-hour chart is still neutral-to-downward biased. Therefore, the GBP/USD first support would be the confluence of the 100 and 200-EMA around 1.2065-68. The break below will send the pair tumbling towards the S1 pivot at 1.1990, followed by the S2 at 1.1910.

GBP/USD 4-hour chart

GBP/USD Key Technical Levels

GBP/USD

Overview
Today last price1.2081
Today Daily Change0.0025
Today Daily Change %0.21
Today daily open1.2056
 
Trends
Daily SMA201.2031
Daily SMA501.218
Daily SMA1001.2478
Daily SMA2001.2949
 
Levels
Previous Daily High1.2164
Previous Daily Low1.2003
Previous Weekly High1.2294
Previous Weekly Low1.2003
Previous Monthly High1.2246
Previous Monthly Low1.176
Daily Fibonacci 38.2%1.2065
Daily Fibonacci 61.8%1.2102
Daily Pivot Point S11.1985
Daily Pivot Point S21.1914
Daily Pivot Point S31.1825
Daily Pivot Point R11.2146
Daily Pivot Point R21.2235
Daily Pivot Point R31.2306

Author

Christian Borjon Valencia

Christian Borjon began his career as a retail trader in 2010, mainly focused on technical analysis and strategies around it. He started as a swing trader, as he used to work in another industry unrelated to the financial markets.

More from Christian Borjon Valencia
Share:

Markets move fast. We move first.

Orange Juice Newsletter brings you expert driven insights - not headlines. Every day on your inbox.

By subscribing you agree to our Terms and conditions.

Editor's Picks

EUR/USD recovers to 1.1750 region as 2025 draws to a close

Following the bearish action seen in the European session on Wednesday, EUR/USD regains its traction and recovery to the 1.1750 region. Nevertheless, the pair's volatility remains low as trading conditions thin out on the last day of the year.

GBP/USD stays weak near 1.3450 on modest USD recovery

GBP/USD remains under modest beairsh pressure and fluctuates at around 1.3450 on Wednesday. The US Dollar finds fresh demand due to the end-of-the-year position adjustments, weighing on the pair amid the pre-New Year trading lull. 

Gold retreats to $4,300 area, looks to post monthly gains

Gold stays on the back foot on the last day of 2025 and trades near $4,300, possibly pressured by profit-taking and position adjustments. Nevertheless, XAU/USD remains on track to post gains for December and extend its winning streak into a fifth consecutive month.

Bitcoin, Ethereum and XRP prepare for a potential New Year rebound

Bitcoin, Ethereum, and Ripple are holding steady on Wednesday after recording minor gains on the previous day. Technically, Bitcoin could extend gains within a triangle pattern while Ethereum and Ripple face critical overhead resistance. 

Economic outlook 2026-2027 in advanced countries: Solidity test

After a year marked by global economic resilience and ending on a note of optimism, 2026 looks promising and could be a year of solid economic performance. In our baseline scenario, we expect most of the supportive factors at work in 2025 to continue to play a role in 2026.

Crypto market outlook for 2026

Year 2025 was volatile, as crypto often is.  Among positive catalysts were favourable regulatory changes in the U.S., rise of Digital Asset Treasuries (DAT), adoption of AI and tokenization of Real-World-Assets (RWA).