|

GBP/USD Price Analysis: Retreats from 200-SMA, weekly resistance line, Cable bears eye 1.2425

  • GBP/USD takes offers to refresh intraday low, fades the previous day’s corrective bounce off three-week low.
  • Convergence of 200-SMA, one-week-old descending trend line guards Sterling Pound’s immediate upside.
  • One-month-old rising support line can prod the Cable pair sellers.

GBP/USD prints three-day downtrend despite positing mild losses around 1.2480 during early Thursday, fading the previous day’s bounce off a three-week low.

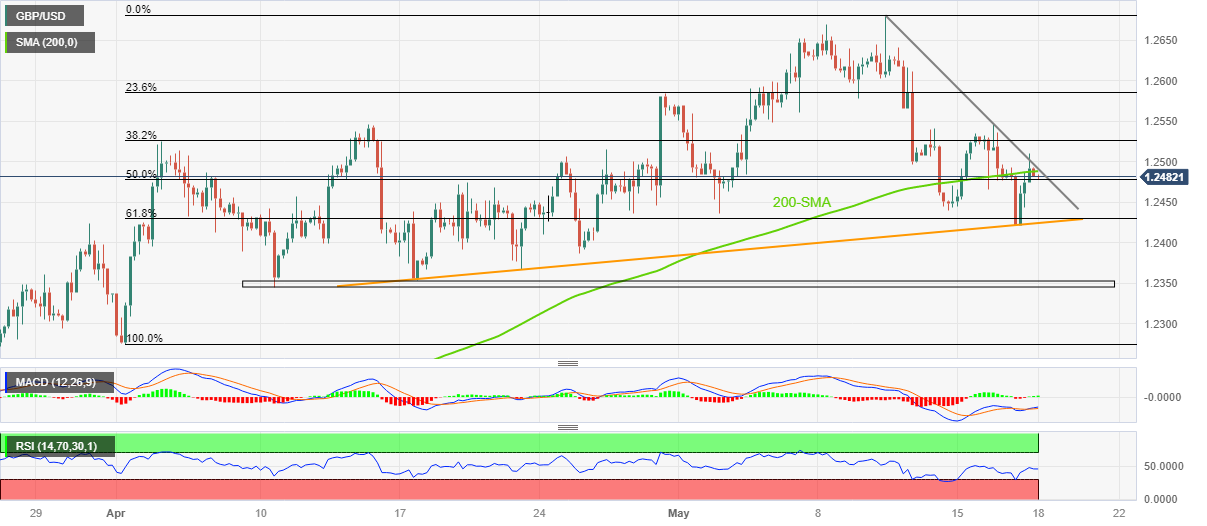
In doing so, the Pound Sterling takes a U-turn from the convergence of the 200-SMA and a downward-sloping resistance line from May 10, close to 1.2490 at the latest. Adding strength to the pullback moves are the steady RSI (14) line and sluggish MACD signals.

As a result, the Cable pair appears all set to drop towards the 61.8% Fibonacci retracement level of its April-May upside, near 1.2430. However, a one-month-old ascending support line, close to 1.2425 by the press time, appears a tough nut to crack for the GBP/USD bears afterward.

In a case where the GBP/USD price drops below 1.2425, the odds of witnessing a quick fall toward a five-week-old horizontal support zone near 1.2355-45 can’t be ruled out.

On the flip side, the GBP/USD pair’s recovery needs to provide a successful break of the 1.2490 resistance confluence to convince buyers.

Following that, the tops marked during mid-April and 23.6% Fibonacci retracement, respectively near 1.2545 and 1.2585, may challenge the Cable pair buyers before directing them to the recently marked multi-day peak of 1.2680.

GBP/USD: Four-hour chart

Trend: Limited downside expected

Additional important levels

Overview
Today last price1.2481
Today Daily Change-0.0006
Today Daily Change %-0.05%
Today daily open1.2487
 
Trends
Daily SMA201.2519
Daily SMA501.2393
Daily SMA1001.2263
Daily SMA2001.1966
 
Levels
Previous Daily High1.251
Previous Daily Low1.2422
Previous Weekly High1.268
Previous Weekly Low1.244
Previous Monthly High1.2584
Previous Monthly Low1.2275
Daily Fibonacci 38.2%1.2456
Daily Fibonacci 61.8%1.2476
Daily Pivot Point S11.2436
Daily Pivot Point S21.2384
Daily Pivot Point S31.2347
Daily Pivot Point R11.2524
Daily Pivot Point R21.2562
Daily Pivot Point R31.2613

Author

Anil Panchal

Anil Panchal

FXStreet

Anil Panchal has nearly 15 years of experience in tracking financial markets. With a keen interest in macroeconomics, Anil aptly tracks global news/updates and stays well-informed about the global financial moves and their implications.

More from Anil Panchal
Share:

Editor's Picks

EUR/USD deflates to multi-week lows near 1.1640

EUR/USD is down for the third straight day on Thursday, coming under extra downside pressure and approaching its transitory 55-day SMA around 1.1640 amid tge persistent recovery in the Greenback. Moving forward, market participants should remain prudent ahead of the release of Friday’s US NFP figures.

GBP/USD: Further weakness could challenge 1.3400

GBP/USD remains under unabated selling pressure on Thursday, slipping to fresh three-day lows around 1.3415 in response to further improvement in the sentiment surrounding the Greenback ahead of Friday’s key NFP data.

Gold edges lower as bulls opt to wait for the crucial US NFP report

Gold struggles to capitalize on the previous day's goodish move up from the vicinity of the $4,400 mark and attracts some sellers during the Asian session on Friday as bulls seem reluctant ahead of the US NFP report. The critical US employment details will offer more cues about the Fed's rate-cut path, which, in turn, will influence the US Dollar price dynamics and provide a fresh impetus to the non-yielding bullion. In the meantime, dovish Fed expectations and rising geopolitical tensions might continue to act as a tailwind for the XAU/USD.

XRP slides as institutional and retail demand falters

Ripple (XRP) is trading down for the third consecutive day on Thursday amid escalating volatility in the cyrptocurrency market. After peaking at $2.41 on Tuesday, its highest print since November 14 amid the early-year rally, XRP has quickly ran into aggressive profit-taking.

2026 economic outlook: Clear skies but don’t unfasten your seatbelts yet

Most years fade into the background as soon as a new one starts. Not 2025: a year of epochal shifts, in which the macroeconomy was the dog that did not bark. What to expect in 2026? The shocks of 2025 will not be undone, but neither will they be repeated.

XRP slides as institutional and retail demand falters

Ripple is trading down for the third consecutive day on Thursday amid escalating volatility in the cyrptocurrency market. After peaking at $2.41 on Tuesday, its highest print since November 14 amid the early-year rally, XRP has quickly ran into aggressive profit-taking.