|

GBP/USD Price Analysis: Retakes 1.3400 mark, bulls eyeing a move towards channel resistance

  • GBP/USD edged higher through the first half of the trading action on Thursday.
  • The set-up favours bullish traders and supports prospects for additional gains.
  • Only a sustained break below the 1.3285-80 region will negate the positive bias.

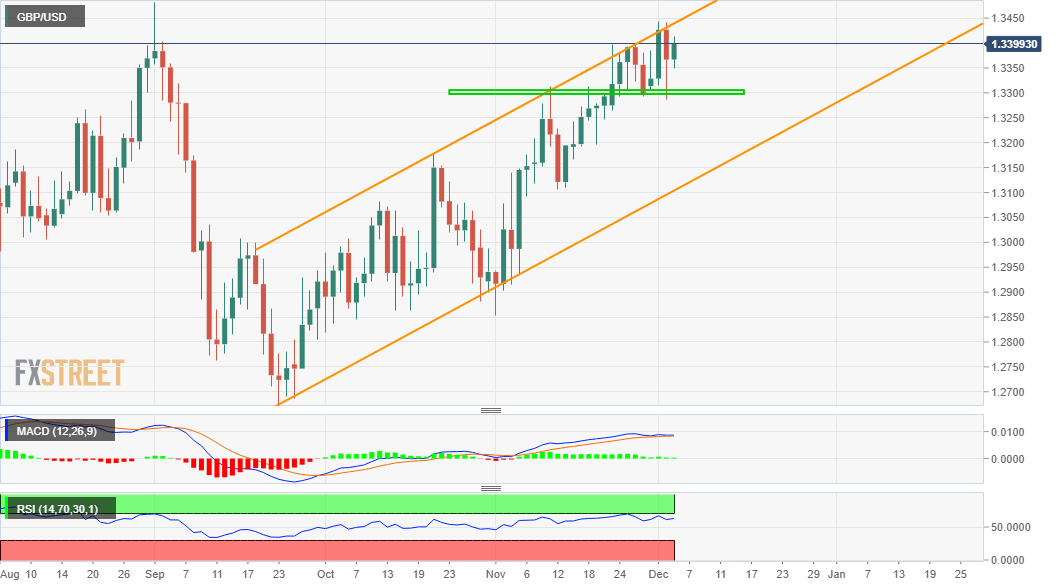
The GBP/USD pair regained positive traction on Thursday and built on the previous day's intraday bounce from sub-1.3300 levels. The pair has now reclaimed the 1.3400 mark, with bulls now eyeing a move towards three-month tops set earlier this week.

From a technical perspective, the recent move up from the 1.2675 region – lows touched on September 23 – has been along an upward sloping channel and points to a well-established bullish trend. This, along with the emergence of some dip-buying near the 1.3285-80 region, supports prospects for an extension of the appreciating move.

The positive outlook if further reinforced by the fact that technical indicators on the daily chart maintained their bullish bias and are still far from being in the overbought territory. That said, the GBP/USD pair's inability to break through the channel resistance warrants some caution before placing aggressive bullish bets.

The mentioned barrier is currently pegged near the 1.3440 region, which if cleared decisively will be seen as a fresh trigger for bullish traders and pave the way for additional gains. The GBP/USD pair might then surpass September monthly swing highs, around the 1.3480 area, and aim to reclaim the key 1.3500 psychological mark.

On the flip side, immediate support is now pegged near the 1.3370-65 region. Any subsequent fall below might still be seen as a buying opportunity near the 1.3300 mark. This, in turn, should help limit the downside near the 1.3285-80 horizontal support, which if broken will negate the constructive set-up and prompt some technical selling.

GBP/USD daily chart

fxsoriginal

Technical levels to watch

GBP/USD

Overview
Today last price1.3403
Today Daily Change0.0036
Today Daily Change %0.27
Today daily open1.3367
 
Trends
Daily SMA201.3268
Daily SMA501.3079
Daily SMA1001.3045
Daily SMA2001.2735
 
Levels
Previous Daily High1.3441
Previous Daily Low1.3288
Previous Weekly High1.3398
Previous Weekly Low1.3264
Previous Monthly High1.3398
Previous Monthly Low1.2854
Daily Fibonacci 38.2%1.3346
Daily Fibonacci 61.8%1.3383
Daily Pivot Point S11.3289
Daily Pivot Point S21.3212
Daily Pivot Point S31.3136
Daily Pivot Point R11.3443
Daily Pivot Point R21.3519
Daily Pivot Point R31.3596

Author

Haresh Menghani

Haresh Menghani is a detail-oriented professional with 10+ years of extensive experience in analysing the global financial markets.

More from Haresh Menghani
Share:

Editor's Picks

EUR/USD looks to regain the 200-day SMA

EUR/USD regains some balance and trade just above 1.1600 the figure ahead of the opening bell in Asia. The pair initially dipped to the 1.1530 zone for the first time since November, always following the stronger US Dollar and the marked flight-to-safety in the context of the ongoing Middle East crisis
 

GBP/USD attacks 1.3300, refreshing three-month lows

GBP/USD is deep in the red near 1.3300, accelerating its downside to renew three-month lows in European trading on Tuesday. The ongoing escalation in the Iran war, combined with rising Oil prices, weighs negatively on the higher-yielding Pound Sterling as the US Dollar capitalizes on increased haven demand.

Gold bounces off lows, back above $5,100

Gold remains on the defensive, eroding part of the recent multi-day advance and managing to trade back above the $5,100 mark per troy ounce on Tuesday. The precious metal initially dropped just below the critical $5,000 threshold on the back of the persistent strength of the Greenback, higher US Treasury yields across the curve and investors' repricing of Fed rate cuts.

XRP risks extending losses as US-Iran war rages on

Ripple (XRP) has come under pressure, drifting lower to $1.35 at the time of writing on Tuesday. The over 2% correction looks poised to erase the previous day’s gains, which lifted the remittance token to $1.42.

Energy shock 2.0: Why rising Gas prices could hit the Euro

Even without a confirmed, sustained disruption, the mere risk to a key global energy chokepoint is enough to inject a significant premium into European Gas markets. And for the Euro, that matters.

Ripple falters amid sell-off jitters and negative funding rates

Ripple (XRP) has come under pressure, drifting lower to $1.35 at the time of writing on Tuesday. The over 2% correction looks poised to erase the previous day’s gains, which lifted the remittance token to $1.42.