|

GBP/USD Price Analysis: Renews six-week low with eyes on 1.1920 support and UK Retail Sales

  • GBP/USD takes offers to refresh multi-day low, drops for the third consecutive day.
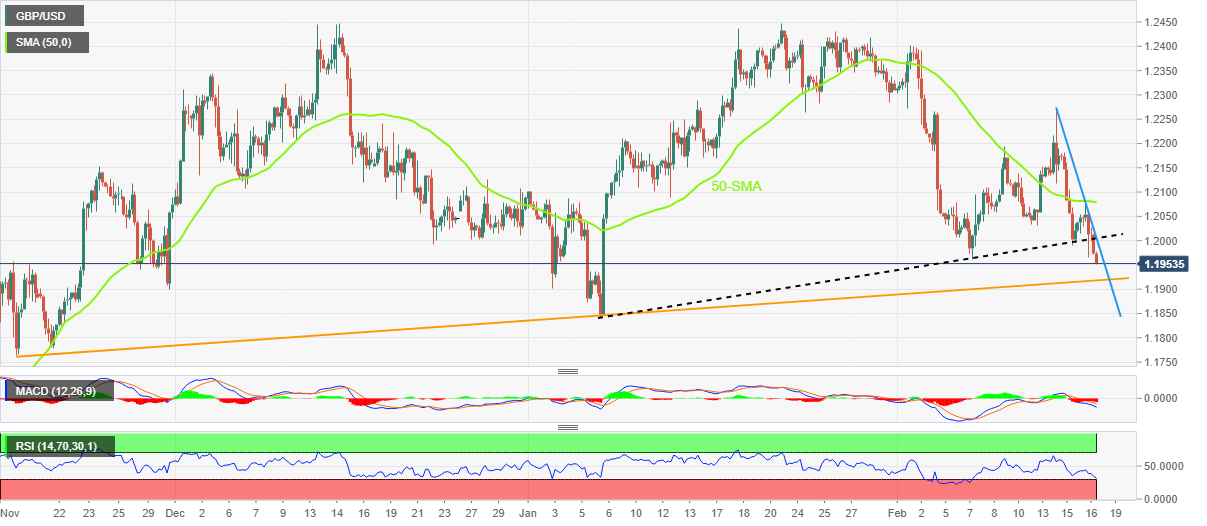
  • Clear downside break of six-week-old trend line, bearish MACD signals favor sellers.
  • Nearly oversold RSI (14) suggests limited room towards the south.
  • 50-SMA holds the key to buyer’s conviction, 1.2000 threshold guards immediate upside.

GBP/USD stands on slippery grounds as it refreshes the 1.5-month low near 1.1950 during early Friday. In doing so, the Cable pair extends the previous day’s downside break of a six-week-old ascending trend line during the three-day losing streak.

Not only the break of a multi-day-old ascending trend line but the bearish MACD signals also favor the GBP/USD sellers.

However, the RSI (14) line is near the oversold territory and suggests consolidation in the Cable price before the next leg towards the south.

As a result, an upward-sloping support line from November 17, 2022, around 1.1920 by the press time, becomes an important support to watch.

Should the GBP/USD pair remains bearish past 1.1920, the odds of witnessing a slump toward the previous monthly low of 1.1841 can’t be ruled out. It’s worth noting that the 1.1900 threshold acts as an extra filter during the anticipated fall.

Alternatively, a convergence of the previous support line from early January and the descending trend line from Tuesday, near the 1.2000 psychological magnet, appears a short-term key hurdle to watch for the GBP/USD pair buyers during a corrective bounce.

Following that the 50-SMA level surrounding 1.2080 should lure the Cable bulls.

On a different page, most of the UK data have been downbeat so far and hence pessimistic expectations from the British Retail Sales for January, up for publishing at 07:00 GMT on Friday, seem to weigh on the quote. Even so, market consensus signals -0.3% MoM figure versus -1.0% previous readings.

GBP/USD: Four-hour chart
Trend: Limited downside expected

Additional important levels

Overview
Today last price1.1952
Today Daily Change-0.0040
Today Daily Change %-0.33%
Today daily open1.1992
 
Trends
Daily SMA201.2214
Daily SMA501.2178
Daily SMA1001.1894
Daily SMA2001.1941
 
Levels
Previous Daily High1.2074
Previous Daily Low1.1966
Previous Weekly High1.2194
Previous Weekly Low1.1961
Previous Monthly High1.2448
Previous Monthly Low1.1841
Daily Fibonacci 38.2%1.2007
Daily Fibonacci 61.8%1.2033
Daily Pivot Point S11.1947
Daily Pivot Point S21.1902
Daily Pivot Point S31.1839
Daily Pivot Point R11.2056
Daily Pivot Point R21.212
Daily Pivot Point R31.2165

Author

Anil Panchal

Anil Panchal

FXStreet

Anil Panchal has nearly 15 years of experience in tracking financial markets. With a keen interest in macroeconomics, Anil aptly tracks global news/updates and stays well-informed about the global financial moves and their implications.


More from Anil Panchal
Share:

Editor's Picks

AUD/USD keeps range near mid-0.7100s as USD bulls await US CPI

AUD/USD steadies near mid-0.7100s in the Asian session on Friday, stalling the previous day's sharp decline to an over one-week low. The August PPI report reaffirmed Fed rate-hike bets and boosted the US Dollar on Thursday, which weighed heavily on the pair. However, hawkish RBA expectations limited losses for the Aussie as USD bulls now await the release of the US consumer inflation figures before placing fresh bets.

USD/JPY holds lower ground toward 154.00; looks to US CPI

USD/JPY holds lower ground toward 154.00 in the Asian session on Friday after hot Japanese PPI data bolster a more hawkish BoJ repricing and provide fresh impetus to the Japanese Yen. However, the downside appears capped as the US Dollar preserves overnight gains ahead of the latest US consumer inflation data.

Gold: Gains remain capped by $4,400

Gold regains composure and trades with decent gains on Friday, managing to refocus attention on the $4,440 mark per ounce troy. Therefore, the precious metal reverses Thursday’s decline as the US Dollar alternates gains with losses at the end of the week.

Ripple Price Forecast: XRP extends decline as returning ETF inflows fail to lift outlook
Ripple (XRP) falls below $1.33 on Friday, marking the third consecutive day of declines. The token continues to track the broader cryptocurrency market downturn, with investors closely monitoring heightened macroeconomic uncertainty ahead of the United States (US) Consumer Price Index (CPI) release and next week’s Federal Reserve (Fed) monetary policy decision.
Weekly focus – The hawks set the tone
Risky assets came under pressure this week as energy prices kept creeping higher and the ECB surprised the markets with a hawkish tone. The price of Brent crude touched USD 110 per barrel on Thursday night, highest since mid-May, as news emerged that the Yemeni Houthis had reached control of key port cities and islands near the Bab el-Mandeb strait.
Venezuela’s 65-billion-barrel Oil deal could reshape America’s inflation fight
The United States (US) has secured unprecedented access to part of Venezuela’s vast Oil reserves. The timing is particularly significant as the war with Iran is disrupting Middle Eastern supplies, keeping energy prices elevated and reviving concerns about inflation.















