GBP/USD Price Analysis: Refreshes weekly high, eyes 200-day SMA near mid-1.2100s
- GBP/USD climbs to a fresh weekly high on Thursday amid sustained USD selling bias.
- Dovish remarks by Fed Chair Powell, weaker US bond yields weigh on the greenback.
- The technical set-up favours bullish traders and supports prospects for further gains.

The GBP/USD pair builds on the previous day's goodish rebound from a one-week low and gains traction for the second successive day on Thursday. The pair maintains its bid tone through the first half of the European session and hits a fresh weekly high, around the 1.2130-1.2135 area in the last hour.
The overnight dovish-sounding remarks by Fed Chair Jerome Powell, along with a further decline in the US Treasury bond yields, keep the US Dollar bulls on the defensive near a multi-month low. Apart from this, a generally positive tone around the equity markets is seen undermining the safe-haven buck and acting as a tailwind for the GBP/USD pair.
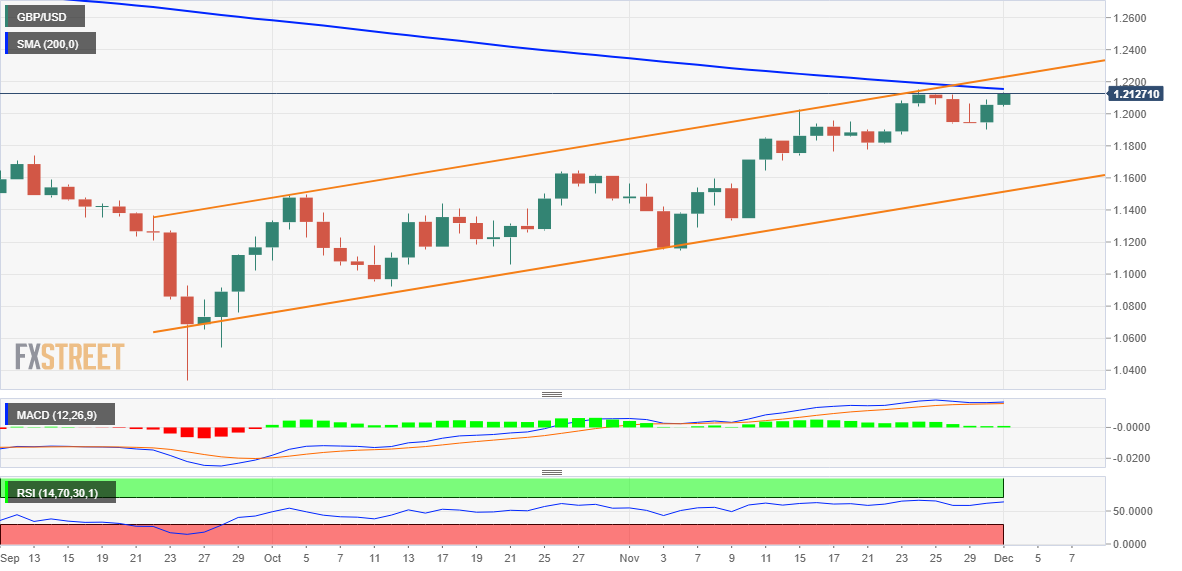
From a technical perspective, spot prices have now moved well within the striking distance of the very important 200-day SMA. The said barrier is currently pegged near the 1.2150 area, which if cleared will be seen as a fresh trigger for bullish traders and set the stage for an extension of the near-term appreciating move for the GBP/USD pair.
Given that oscillators on the daily chart are holding in the bullish territory and are still far from being in the overbought zone, the GBP/USD pair might then aim to reclaim the 1.2200 mark. The momentum could further get extended and lift spot prices to the top boundary of over a two-month-old ascending channel, currently around the 1.2300 round figure.
On the flip side, any meaningful pullback below the 1.2100 mark now seems to find decent support near the daily low, around the 1.2045 region. A convincing break below might prompt some technical selling and drag the GBP/USD pair back toward the 1.2000 psychological mark. Some follow-through selling will expose the 1.1945-1.1940 horizontal support.
The latter should act as a strong base for spot prices, which if broken decisively will negate any near-term positive bias and pave the way for a deeper corrective decline. The GBP/USD pair might then turn vulnerable to weaken further below the 1.1900 mark and test the next relevant support near the 1.1860-1.1855 horizontal zone.
GBP/USD daily chart
Key levels to watch
Author

Haresh Menghani
FXStreet
Haresh Menghani is a detail-oriented professional with 10+ years of extensive experience in analysing the global financial markets.


